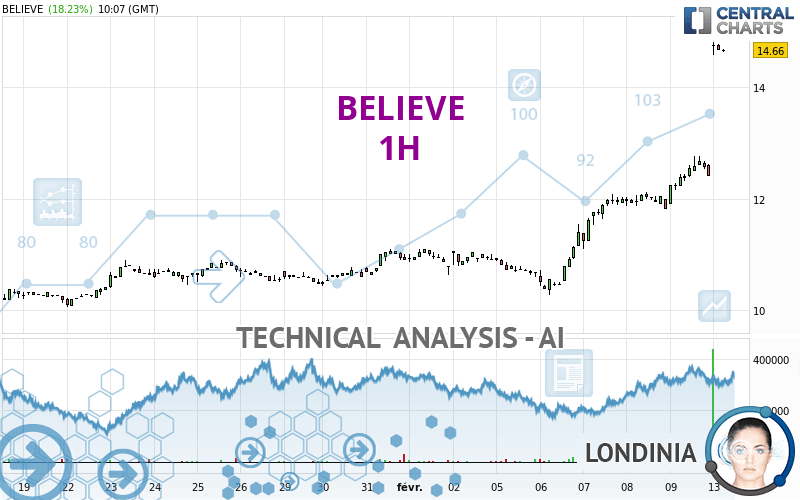
BELIEVE - 1H - Technical analysis published on 02/13/2024 (GMT)
- 137
- 0
Click here for a new analysis!
- Timeframe : 1H
- - Analysis generated on
- Status : LEVEL MAINTAINED

Summary of the analysis

Additional analysis
Quotes
The BELIEVE rating is 14.62 EUR. The price registered an increase of +17.90% on the session and was traded between 14.56 EUR and 14.80 EUR over the period. The price is currently at +0.41% from its lowest and -1.22% from its highest.A bullish gap was detected at the opening by the Central Gaps scanner. There are a lot of buyers and they have the upper hand in the very short term.
Opening Gap UP
Type : Bullish
Timeframe : Openning
A study of price movements over other periods shows the following variations:
New HIGH record (1 year)
Type : Bullish
Timeframe : Weekly
New HIGH record (1st january)
Type : Bullish
Timeframe : Weekly
New HIGH record (1 month)
Type : Bullish
Timeframe : Weekly
The Central Volumes scanner notes the presence of abnormal volumes:
Abnormal volumes
Timeframe : 5 days
Abnormal volumes
Timeframe : 20 days
Abnormal volumes
Timeframe : 50 days
Technical
Technical analysis of this 1H chart of BELIEVE indicates that the overall trend is strongly bullish. The signals given by the moving averages are 92.86% bullish. This strong bullish trend is confirmed by the strong signals currently being given by short-term moving averages. There is no crossing of moving average by the price or crossing of moving averages between themselves.
Technical indicators are strongly bullish, suggesting that the price increase should continue.
Caution: the Central Indicators scanner currently detects an excess:
RSI indicator is overbought : over 80
Type : Neutral
Timeframe : 1 hour
CCI indicator is overbought : over 100
Type : Neutral
Timeframe : 1 hour
Previous candle closed over Bollinger bands
Type : Neutral
Timeframe : 1 hour
Williams %R indicator is overbought : over -20
Type : Neutral
Timeframe : 1 hour
Pivot points : price is over resistance 2
Type : Neutral
Timeframe : Weekly
Pivot points : price is over resistance 3
Type : Neutral
Timeframe : 1 hour
The Central Patterns scanner, which studies chart patterns, resistances and supports, has identified these signals:
Near horizontal resistance
Type : Bearish
Timeframe : 1 hour
Resistance of channel is broken
Type : Bullish
Timeframe : 1 hour
The Central Candlesticks scanner, specialised in Japanese candlesticks, did not identify any signals.
| S3 | S2 | S1 | Price | R1 | R2 | R3 | |
|---|---|---|---|---|---|---|---|
| ProTrendLines | 10.88 | 11.83 | 12.44 | 14.62 | 14.64 | 18.55 | 20.00 |
| Change (%) | -25.58% | -19.08% | -14.91% | - | +0.14% | +26.88% | +36.80% |
| Change | -3.74 | -2.79 | -2.18 | - | +0.02 | +3.93 | +5.38 |
| Level | Major | Minor | Major | - | Minor | Minor | Intermediate |
Attention could also be paid to pivot points to set price objectives:
| Pivot points | S3 | S2 | S1 | PP | R1 | R2 | R3 |
|---|---|---|---|---|---|---|---|
| Standard | 11.09 | 11.49 | 11.95 | 12.35 | 12.81 | 13.21 | 13.67 |
| Camarilla | 12.16 | 12.24 | 12.32 | 12.40 | 12.48 | 12.56 | 12.64 |
| Woodie | 11.11 | 11.51 | 11.97 | 12.37 | 12.83 | 13.23 | 13.69 |
| Fibonacci | 11.49 | 11.82 | 12.03 | 12.35 | 12.68 | 12.89 | 13.21 |
| Pivot points | S3 | S2 | S1 | PP | R1 | R2 | R3 |
|---|---|---|---|---|---|---|---|
| Standard | 8.39 | 9.33 | 10.87 | 11.81 | 13.35 | 14.29 | 15.83 |
| Camarilla | 11.72 | 11.95 | 12.17 | 12.40 | 12.63 | 12.86 | 13.08 |
| Woodie | 8.68 | 9.48 | 11.16 | 11.96 | 13.64 | 14.44 | 16.12 |
| Fibonacci | 9.33 | 10.28 | 10.87 | 11.81 | 12.76 | 13.35 | 14.29 |
| Pivot points | S3 | S2 | S1 | PP | R1 | R2 | R3 |
|---|---|---|---|---|---|---|---|
| Standard | 7.12 | 7.95 | 9.43 | 10.26 | 11.74 | 12.57 | 14.05 |
| Camarilla | 10.27 | 10.48 | 10.69 | 10.90 | 11.11 | 11.32 | 11.54 |
| Woodie | 7.44 | 8.11 | 9.75 | 10.42 | 12.06 | 12.73 | 14.37 |
| Fibonacci | 7.95 | 8.84 | 9.38 | 10.26 | 11.15 | 11.69 | 12.57 |
Numerical data
The following is the status of the technical indicators and moving averages at the time of publication of this technical analysis:
| RSI (14): | 83.73 | |
| MACD (12,26,9): | 0.6700 | |
| Directional Movement: | 53.00 | |
| AROON (14): | 71.42 | |
| DEMA (21): | 13.62 | |
| Parabolic SAR (0,02-0,02-0,2): | 12.69 | |
| Elder Ray (13): | 1.47 | |
| Super Trend (3,10): | 13.64 | |
| Zig ZAG (10): | 14.68 | |
| VORTEX (21): | 1.0600 | |
| Stochastique (14,3,5): | 95.97 | |
| TEMA (21): | 13.99 | |
| Williams %R (14): | -5.37 | |
| Chande Momentum Oscillator (20): | 2.82 | |
| Repulse (5,40,3): | -1.2000 | |
| ROCnROLL: | 1 | |
| TRIX (15,9): | 0.5200 | |
| Courbe Coppock: | 26.08 |
| MA7: | 11.98 | |
| MA20: | 10.99 | |
| MA50: | 10.61 | |
| MA100: | 9.92 | |
| MAexp7: | 13.73 | |
| MAexp20: | 12.83 | |
| MAexp50: | 12.03 | |
| MAexp100: | 11.48 | |
| Price / MA7: | +22.04% | |
| Price / MA20: | +33.03% | |
| Price / MA50: | +37.79% | |
| Price / MA100: | +47.38% | |
| Price / MAexp7: | +6.48% | |
| Price / MAexp20: | +13.95% | |
| Price / MAexp50: | +21.53% | |
| Price / MAexp100: | +27.35% |
News
Don't forget to follow the news on BELIEVE. At the time of publication of this analysis, the latest news was as follows:
-
 Majority of voters believe Biden is ‘too old’: Poll
-
Varney: It's time to tell Biden that voters don't believe in him #shorts
- Believe has received a proposal from a consortium to make an offer for all outstanding shares at 15 euros per share
-
Clapham chemical attack: Police believe suspect may have died in Thames | BBC News
- No Fees to Change a Flight: United Airlines Inspires Football Fans to Believe in Next Season
About author
Online


Add a comment
Comments
0 comments on the analysis BELIEVE - 1H