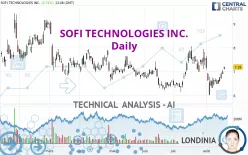
SOFI TECHNOLOGIES INC. - Daily - Technical analysis published on 08/19/2024 (GMT)
- 132
- 0
Click here for a new analysis!
- Timeframe : Daily
- - Analysis generated on
- Status : TARGET REACHED

Summary of the analysis

Additional analysis
Quotes
SOFI TECHNOLOGIES INC. rating 7.19 USD. On the day, this instrument gained +2.71% and was between 7.09 USD and 7.20 USD. This implies that the price is at +1.41% from its lowest and at -0.14% from its highest.The Central Gaps scanner detects a bullish gap which is a sign that buyers have taken the lead in the very short term.
Opening Gap UP
Type : Bullish
Timeframe : Openning
So that you have an overall view of the price change, here is a table showing the variations over several periods:
Technical
A technical analysis in Daily of this SOFI TECHNOLOGIES INC. chart shows a slightly bullish trend. 60.71% of the signals given by moving averages are bullish. The overall trend remains fragile, as do the slightly bullish signals given by short-term moving averages. The Central Indicators market scanner is currently detecting several bullish signals that could impact this trend:
Bullish trend reversal : adaptative moving average 50
Type : Bullish
Timeframe : Daily
Bullish price crossover with Moving Average 100
Type : Bullish
Timeframe : Daily
Bullish price crossover with adaptative moving average 20
Type : Bullish
Timeframe : Daily
Bullish price crossover with adaptative moving average 50
Type : Bullish
Timeframe : Daily
In fact, 12 technical indicators on 18 studied are currently positioned bullish. Central Indicators, the scanner specialised in technical indicators, has identified these signals:
Pivot points : price is over resistance 1
Type : Neutral
Timeframe : Daily
Pivot points : price is over resistance 1
Type : Neutral
Timeframe : Weekly
MACD crosses UP its Moving Average
Type : Bullish
Timeframe : Daily
Ichimoku : price is over the cloud
Type : Bullish
Timeframe : Daily
No signals are given by Central Patterns, a market scanner specialised in chart patterns, resistances and supports.
Central Candlesticks, the scanner specialised in Japanese candlesticks, detects a bullish signal that could support the hypothesis of a small rebound in the very short term:
Upside gap
Type : Bullish
Timeframe : Daily
| S2 | S1 | Price | R1 | R2 | R3 | |
|---|---|---|---|---|---|---|
| ProTrendLines | 6.52 | 6.92 | 7.19 | 7.88 | 9.16 | 10.30 |
| Change (%) | -9.32% | -3.76% | - | +9.60% | +27.40% | +43.25% |
| Change | -0.67 | -0.27 | - | +0.69 | +1.97 | +3.11 |
| Level | Major | Intermediate | - | Major | Minor | Major |
Attention could also be paid to pivot points to set price objectives:
| Pivot points | S3 | S2 | S1 | PP | R1 | R2 | R3 |
|---|---|---|---|---|---|---|---|
| Standard | 6.71 | 6.80 | 6.90 | 6.99 | 7.09 | 7.18 | 7.28 |
| Camarilla | 6.95 | 6.97 | 6.98 | 7.00 | 7.02 | 7.04 | 7.05 |
| Woodie | 6.72 | 6.80 | 6.91 | 6.99 | 7.10 | 7.18 | 7.29 |
| Fibonacci | 6.80 | 6.87 | 6.92 | 6.99 | 7.06 | 7.11 | 7.18 |
| Pivot points | S3 | S2 | S1 | PP | R1 | R2 | R3 |
|---|---|---|---|---|---|---|---|
| Standard | 6.01 | 6.24 | 6.62 | 6.85 | 7.23 | 7.46 | 7.84 |
| Camarilla | 6.83 | 6.89 | 6.94 | 7.00 | 7.06 | 7.11 | 7.17 |
| Woodie | 6.09 | 6.28 | 6.70 | 6.89 | 7.31 | 7.50 | 7.92 |
| Fibonacci | 6.24 | 6.47 | 6.62 | 6.85 | 7.08 | 7.23 | 7.46 |
| Pivot points | S3 | S2 | S1 | PP | R1 | R2 | R3 |
|---|---|---|---|---|---|---|---|
| Standard | 4.53 | 5.34 | 6.44 | 7.25 | 8.35 | 9.16 | 10.26 |
| Camarilla | 7.02 | 7.19 | 7.37 | 7.54 | 7.72 | 7.89 | 8.07 |
| Woodie | 4.68 | 5.41 | 6.59 | 7.32 | 8.50 | 9.23 | 10.41 |
| Fibonacci | 5.34 | 6.07 | 6.52 | 7.25 | 7.98 | 8.43 | 9.16 |
Numerical data
The following are the details of the technical indicators and moving averages that were collected to generate this technical analysis:
| RSI (14): | 56.76 | |
| MACD (12,26,9): | -0.0400 | |
| Directional Movement: | 4.24 | |
| AROON (14): | -28.57 | |
| DEMA (21): | 6.83 | |
| Parabolic SAR (0,02-0,02-0,2): | 7.28 | |
| Elder Ray (13): | 0.30 | |
| Super Trend (3,10): | 7.66 | |
| Zig ZAG (10): | 7.16 | |
| VORTEX (21): | 0.9400 | |
| Stochastique (14,3,5): | 53.98 | |
| TEMA (21): | 6.79 | |
| Williams %R (14): | -35.99 | |
| Chande Momentum Oscillator (20): | 0.02 | |
| Repulse (5,40,3): | 2.5000 | |
| ROCnROLL: | 1 | |
| TRIX (15,9): | -0.1200 | |
| Courbe Coppock: | 13.25 |
| MA7: | 6.77 | |
| MA20: | 6.93 | |
| MA50: | 6.85 | |
| MA100: | 7.02 | |
| MAexp7: | 6.87 | |
| MAexp20: | 6.88 | |
| MAexp50: | 6.93 | |
| MAexp100: | 7.08 | |
| Price / MA7: | +6.20% | |
| Price / MA20: | +3.75% | |
| Price / MA50: | +4.96% | |
| Price / MA100: | +2.42% | |
| Price / MAexp7: | +4.66% | |
| Price / MAexp20: | +4.51% | |
| Price / MAexp50: | +3.75% | |
| Price / MAexp100: | +1.55% |
News
Don't forget to follow the news on SOFI TECHNOLOGIES INC.. At the time of publication of this analysis, the latest news was as follows:
- SoFi to Participate in Upcoming Investor Conferences
- SoFi Completes Acquisition of Technisys
- SoFi Schedules Conference Call to Discuss Q4 2021 & Full Year 2021 Results
About author

Online


Add a comment
Comments
0 comments on the analysis SOFI TECHNOLOGIES INC. - Daily