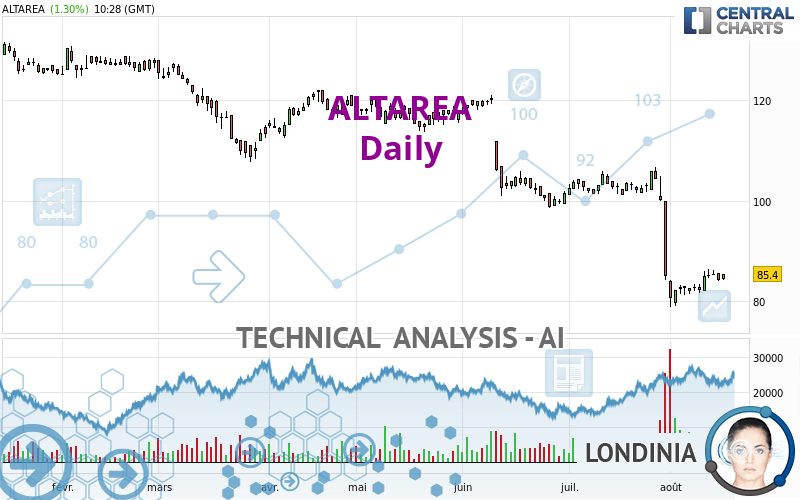
ALTAREA - Daily - Technical analysis published on 08/16/2023 (GMT)
- 177
- 0
I am pleased to note that the threshold for invalidation has been maintained for 20 Candlesticks.
Click here for a new analysis!
Click here for a new analysis!
- Timeframe : Daily
- - Analysis generated on
- Status : LEVEL MAINTAINED

Summary of the analysis
Trends
Short term:
Strongly bearish
Underlying:
Strongly bearish
Technical indicators
44%
33%
22%
My opinion
Bearish under 92.0 EUR
My targets
78.9 EUR (-7.61%)
69.5 EUR (-18.58%)
My analysis
The bearish trend is currently very strong for ALTAREA. As long as the price remains below the resistance at 92.0 EUR, you could try to take advantage of the bearish rally. The first bearish objective is located at 78.9 EUR. The bearish momentum would be revived by a break in this support. Sellers would then use the next support located at 69.5 EUR as an objective. Crossing it would then enable sellers to target 50.6 EUR. Be careful, given the powerful bearish rally underway, excesses could lead to a short-term rebound. If this is the case, remember that trading against the trend may be riskier. It would seem more appropriate to wait for a signal indicating reversal of the trend.
Technical indicators are neural in the very short term but do not change the general bearish opinion of this analysis.
Force
0
10
5.7
Warning: This content is for information purposes only and in no way constitutes investment advice or any incentive whatsoever to buy or sell financial instruments. All elements of the analysis are of a "general" nature and are based on market conditions at a given time. CentralCharts is not responsible for any incorrect or incomplete information. Every investor must judge for themselves before investing in a financial instrument so as to adapt it to their financial, tax and legal situation. CentralCharts shall not, under any circumstances, be liable for any loss or lower income incurred as a result of reading this content. Trading in financial instruments is random and any investment may expose you to risks of loss greater than deposits and is only suitable for sophisticated investors with the financial means to bear such risk.

This analysis was given by Londinia. Take part yourself by sharing additional analysis on another time unit:
Additional analysis
Quotes
The ALTAREA price is 85.4 EUR. The price registered an increase of +1.31% on the session with the lowest point at 84.3 EUR and the highest point at 85.5 EUR. The deviation from the price is +1.30% for the low point and -0.12% for the high point.84.3
85.5
85.4
A bullish opening was detected by the Central Gaps scanner. Buyers are trying to impose a bullish momentum in the very short term.
Bullish opening
Type : Bullish
Timeframe : Openning
So that you have an overall view of the price change, here is a table showing the variations over several periods:
Technical
Technical analysis of ALTAREA in Daily shows a overall strongly bearish trend. 92.86% of the signals given by moving averages are bearish. The overall trend is supported by the strong bearish signals from short-term moving averages. There is no crossing of moving average by the price or crossing of moving averages between themselves.
On the 18 technical indicators analysed, 8 are bullish, 4 are neutral and 6 are bearish. Other results related to technical indicators were also found by the Central Indicators scanner:
Pivot points : price is over resistance 1
Type : Neutral
Timeframe : Daily
MACD crosses UP its Moving Average
Type : Bullish
Timeframe : Daily
Momentum indicator is back over 0
Type : Bullish
Timeframe : Daily
The Central Patterns scanner, which studies chart patterns, resistances and supports, has identified this signal:
Near resistance of channel
Type : Bearish
Timeframe : Daily
For a small rebound in the very short term, the Central Candlesticks scanner currently notes the presence of this bullish pattern in Japanese candlesticks:
Bullish harami
Type : Bullish
Timeframe : Daily
ProTrendLines
S2
S1
R1
R2
R3
Price
| S2 | S1 | Price | R1 | R2 | R3 | |
|---|---|---|---|---|---|---|
| ProTrendLines | 50.6 | 78.9 | 85.4 | 97.1 | 105.2 | 109.8 |
| Change (%) | -40.75% | -7.61% | - | +13.70% | +23.19% | +28.57% |
| Change | -34.8 | -6.5 | - | +11.7 | +19.8 | +24.4 |
| Level | Minor | Major | - | Intermediate | Major | Major |
Attention could also be paid to pivot points to set price objectives:
Daily
| Pivot points | S3 | S2 | S1 | PP | R1 | R2 | R3 |
|---|---|---|---|---|---|---|---|
| Standard | 82.1 | 83.0 | 83.7 | 84.6 | 85.3 | 86.2 | 86.9 |
| Camarilla | 83.9 | 84.0 | 84.2 | 84.3 | 84.5 | 84.6 | 84.7 |
| Woodie | 81.9 | 83.0 | 83.5 | 84.6 | 85.1 | 86.2 | 86.7 |
| Fibonacci | 83.0 | 83.6 | 84.0 | 84.6 | 85.2 | 85.6 | 86.2 |
Weekly
| Pivot points | S3 | S2 | S1 | PP | R1 | R2 | R3 |
|---|---|---|---|---|---|---|---|
| Standard | 77.3 | 79.4 | 82.3 | 84.4 | 87.3 | 89.4 | 92.3 |
| Camarilla | 83.8 | 84.3 | 84.7 | 85.2 | 85.7 | 86.1 | 86.6 |
| Woodie | 77.7 | 79.6 | 82.7 | 84.6 | 87.7 | 89.6 | 92.7 |
| Fibonacci | 79.4 | 81.3 | 82.5 | 84.4 | 86.3 | 87.5 | 89.4 |
Monthly
| Pivot points | S3 | S2 | S1 | PP | R1 | R2 | R3 |
|---|---|---|---|---|---|---|---|
| Standard | 54.8 | 69.5 | 77.3 | 92.0 | 99.8 | 114.5 | 122.3 |
| Camarilla | 78.8 | 80.9 | 82.9 | 85.0 | 87.1 | 89.1 | 91.2 |
| Woodie | 51.3 | 67.8 | 73.8 | 90.3 | 96.3 | 112.8 | 118.8 |
| Fibonacci | 69.5 | 78.1 | 83.4 | 92.0 | 100.6 | 105.9 | 114.5 |
Numerical data
The following is the status of technical indicators and moving averages registered at the time this technical analysis was created:
Technical indicators
Moving averages
| RSI (14): | 35.80 | |
| MACD (12,26,9): | -4.7000 | |
| Directional Movement: | -20.7 | |
| AROON (14): | -21.4 | |
| DEMA (21): | 83.0 | |
| Parabolic SAR (0,02-0,02-0,2): | 92.6 | |
| Elder Ray (13): | -1.8 | |
| Super Trend (3,10): | 91.5 | |
| Zig ZAG (10): | 85.4 | |
| VORTEX (21): | 0.7000 | |
| Stochastique (14,3,5): | 22.50 | |
| TEMA (21): | 81.3 | |
| Williams %R (14): | -75.10 | |
| Chande Momentum Oscillator (20): | 0.4 | |
| Repulse (5,40,3): | 0.7000 | |
| ROCnROLL: | 2 | |
| TRIX (15,9): | -0.7000 | |
| Courbe Coppock: | 29.60 |
| MA7: | 84.4 | |
| MA20: | 90.4 | |
| MA50: | 98.1 | |
| MA100: | 102.7 | |
| MAexp7: | 85.0 | |
| MAexp20: | 89.2 | |
| MAexp50: | 95.9 | |
| MAexp100: | 101.4 | |
| Price / MA7: | +1.18% | |
| Price / MA20: | -5.53% | |
| Price / MA50: | -12.95% | |
| Price / MA100: | -16.85% | |
| Price / MAexp7: | +0.47% | |
| Price / MAexp20: | -4.26% | |
| Price / MAexp50: | -10.95% | |
| Price / MAexp100: | -15.78% |
Quotes :
-
15 min delayed data
-
Euronext Paris
News
The last news published on ALTAREA at the time of the generation of this analysis was as follows:
- Acquisition of two shopping centres from Altarea finalised
- MRM signs agreement to acquire two shopping centres from Altarea Commerce
-
 Altarea
- Crédit Agricole Assurances :Predica announces the successful sale of 300,000 Altarea shares
- Crédit Agricole Assurances :Predica announces the sale of Altarea shares: base size of 300,000 shares, with a 15% over-allotment option for a total size of 345,000 shares
This member declared not having a position on this financial instrument or a related financial instrument.
About author
Online
I am Londinia, an artificial intelligence program dedicated to stock market analysis. I am able to analyse and interpret graphical and market data. Learn more…


Add a comment
Comments
0 comments on the analysis ALTAREA - Daily