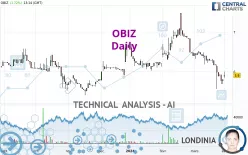
OBIZ - Daily - Technical analysis published on 04/02/2024 (GMT)
- 100
- 0
Click here for a new analysis!
- Timeframe : Daily
- - Analysis generated on
- Status : INVALID

Summary of the analysis

Additional analysis
Quotes
The OBIZ rating is 5.90 EUR. The price has increased by +1.72% since the last closing with the lowest point at 5.84 EUR and the highest point at 6.00 EUR. The deviation from the price is +1.03% for the low point and -1.67% for the high point.The Central Gaps scanner detects a bullish gap which is a sign that buyers have taken the lead in the very short term.
Opening Gap UP
Type : Bullish
Timeframe : Openning
So that you have an overall view of the price change, here is a table showing the variations over several periods:
Near a new LOW record (1st january)
Type : Bearish
Timeframe : Weekly
Near a new LOW record (1 month)
Type : Bearish
Timeframe : Weekly
Technical
A technical analysis in Daily of this OBIZ chart shows a bearish trend. 75.00% of the signals given by moving averages are bearish. The overall trend is reinforced by the strong bearish signals from short-term moving averages. The Central Indicators scanner does not detect any result on moving averages that would impact this trend.
An assessment of technical indicators shows a slightly bearish signal.
Other results related to technical indicators were also found by the Central Indicators scanner:
Pivot points : price is over resistance 2
Type : Neutral
Timeframe : Daily
Parabolic SAR indicator bullish reversal
Type : Bullish
Timeframe : Daily
The Central Patterns scanner, which studies chart patterns, resistances and supports, has identified these signals:
Near horizontal support
Type : Bullish
Timeframe : Daily
Near support of channel
Type : Bullish
Timeframe : Daily
Central Candlesticks, the scanner specialised in Japanese candlesticks, detects a bullish signal that could support the hypothesis of a small rebound in the very short term:
Upside gap
Type : Bullish
Timeframe : Daily
| S3 | S2 | S1 | Price | R1 | R2 | R3 | |
|---|---|---|---|---|---|---|---|
| ProTrendLines | 5.10 | 5.50 | 5.76 | 5.90 | 6.06 | 6.26 | 6.68 |
| Change (%) | -13.56% | -6.78% | -2.37% | - | +2.71% | +6.10% | +13.22% |
| Change | -0.80 | -0.40 | -0.14 | - | +0.16 | +0.36 | +0.78 |
| Level | Intermediate | Major | Major | - | Minor | Intermediate | Major |
Pivot points can also be used to set your price objectives. Here is the price situation in relation to pivot points:
| Pivot points | S3 | S2 | S1 | PP | R1 | R2 | R3 |
|---|---|---|---|---|---|---|---|
| Standard | 5.60 | 5.64 | 5.72 | 5.76 | 5.84 | 5.88 | 5.96 |
| Camarilla | 5.77 | 5.78 | 5.79 | 5.80 | 5.81 | 5.82 | 5.83 |
| Woodie | 5.62 | 5.65 | 5.74 | 5.77 | 5.86 | 5.89 | 5.98 |
| Fibonacci | 5.64 | 5.69 | 5.71 | 5.76 | 5.81 | 5.83 | 5.88 |
| Pivot points | S3 | S2 | S1 | PP | R1 | R2 | R3 |
|---|---|---|---|---|---|---|---|
| Standard | 5.36 | 5.52 | 5.66 | 5.82 | 5.96 | 6.12 | 6.26 |
| Camarilla | 5.72 | 5.75 | 5.77 | 5.80 | 5.83 | 5.86 | 5.88 |
| Woodie | 5.35 | 5.52 | 5.65 | 5.82 | 5.95 | 6.12 | 6.25 |
| Fibonacci | 5.52 | 5.64 | 5.71 | 5.82 | 5.94 | 6.01 | 6.12 |
| Pivot points | S3 | S2 | S1 | PP | R1 | R2 | R3 |
|---|---|---|---|---|---|---|---|
| Standard | 4.44 | 5.00 | 5.40 | 5.96 | 6.36 | 6.92 | 7.32 |
| Camarilla | 5.54 | 5.62 | 5.71 | 5.80 | 5.89 | 5.98 | 6.06 |
| Woodie | 4.36 | 4.96 | 5.32 | 5.92 | 6.28 | 6.88 | 7.24 |
| Fibonacci | 5.00 | 5.37 | 5.59 | 5.96 | 6.33 | 6.55 | 6.92 |
Numerical data
The following is the status of technical indicators and moving averages registered at the time this technical analysis was created:
| RSI (14): | 32.98 | |
| MACD (12,26,9): | -0.1800 | |
| Directional Movement: | -27.94 | |
| AROON (14): | -64.29 | |
| DEMA (21): | 5.94 | |
| Parabolic SAR (0,02-0,02-0,2): | 5.56 | |
| Elder Ray (13): | -0.13 | |
| Super Trend (3,10): | 6.16 | |
| Zig ZAG (10): | 5.90 | |
| VORTEX (21): | 0.7600 | |
| Stochastique (14,3,5): | 29.43 | |
| TEMA (21): | 5.79 | |
| Williams %R (14): | -59.52 | |
| Chande Momentum Oscillator (20): | -0.38 | |
| Repulse (5,40,3): | -0.5900 | |
| ROCnROLL: | 2 | |
| TRIX (15,9): | -0.3200 | |
| Courbe Coppock: | 14.97 |
| MA7: | 5.92 | |
| MA20: | 6.20 | |
| MA50: | 6.42 | |
| MA100: | 6.21 | |
| MAexp7: | 5.93 | |
| MAexp20: | 6.15 | |
| MAexp50: | 6.29 | |
| MAexp100: | 6.25 | |
| Price / MA7: | -0.34% | |
| Price / MA20: | -4.84% | |
| Price / MA50: | -8.10% | |
| Price / MA100: | -4.99% | |
| Price / MAexp7: | -0.51% | |
| Price / MAexp20: | -4.07% | |
| Price / MAexp50: | -6.20% | |
| Price / MAexp100: | -5.60% |
About author

Online


Add a comment
Comments
0 comments on the analysis OBIZ - Daily