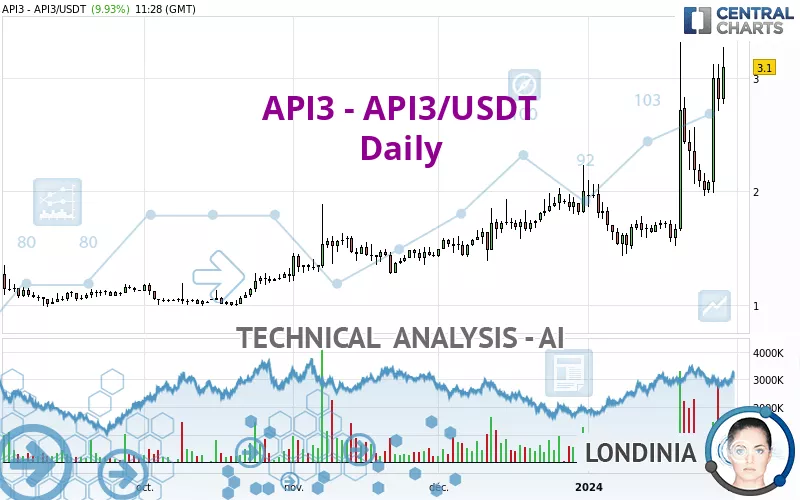
API3 - API3/USDT - Daily - Technical analysis published on 01/29/2024 (GMT)
- 161
- 1
Click here for a new analysis!
- Timeframe : Daily
- - Analysis generated on
- Status : INVALID

Summary of the analysis

Additional analysis
Quotes
The API3 - API3/USDT rating is 3.10 USDT. The price has increased by +9.93% since the last closing and was traded between 2.77 USDT and 3.28 USDT over the period. The price is currently at +11.91% from its lowest and -5.49% from its highest.Here is a more detailed summary of the historical variations registered by API3 - API3/USDT:
Near a new HIGH record (1 year)
Type : Bullish
Timeframe : Weekly
Near a new HIGH record (1st january)
Type : Bullish
Timeframe : Weekly
Near a new HIGH record (1 month)
Type : Bullish
Timeframe : Weekly
The Central Volumes scanner detects abnormal volumes on the asset:
Abnormal volumes
Timeframe : 5 days
Abnormal volumes
Timeframe : 20 days
Technical
Technical analysis of API3 - API3/USDT in Daily shows a strongly overall bullish trend. 92.86% of the signals given by moving averages are bullish. This strongly bullish trend is supported by the strong bullish signals given by short-term moving averages. The Central Indicators market scanner currently does not detect any result that concerns moving averages.
In fact, according to the parameters integrated into the Central Analyzer system, 16 technical indicators out of 18 analysed are currently bullish. Caution: the Central Indicators scanner currently detects an excess:
CCI indicator is overbought : over 100
Type : Neutral
Timeframe : Daily
Williams %R indicator is overbought : over -20
Type : Neutral
Timeframe : Daily
Pivot points : price is over resistance 1
Type : Neutral
Timeframe : Daily
No signals are given by Central Patterns, a market scanner specialised in chart patterns, resistances and supports.
The Central Candlesticks scanner which studies Japanese candlesticks did not detect anything.
| S3 | S2 | S1 | Price | R1 | R2 | R3 | |
|---|---|---|---|---|---|---|---|
| ProTrendLines | 1.58 | 1.99 | 2.72 | 3.10 | 3.38 | 5.18 | 6.58 |
| Change (%) | -49.03% | -35.81% | -12.26% | - | +9.03% | +67.10% | +112.26% |
| Change | -1.52 | -1.11 | -0.38 | - | +0.28 | +2.08 | +3.48 |
| Level | Intermediate | Intermediate | Major | - | Intermediate | Minor | Minor |
Pivot points can also be used to set your price objectives. Here is the price situation in relation to pivot points:
| Pivot points | S3 | S2 | S1 | PP | R1 | R2 | R3 |
|---|---|---|---|---|---|---|---|
| Standard | 2.22 | 2.47 | 2.64 | 2.89 | 3.06 | 3.31 | 3.48 |
| Camarilla | 2.71 | 2.74 | 2.78 | 2.82 | 2.86 | 2.90 | 2.94 |
| Woodie | 2.19 | 2.45 | 2.61 | 2.87 | 3.03 | 3.29 | 3.45 |
| Fibonacci | 2.47 | 2.63 | 2.73 | 2.89 | 3.05 | 3.15 | 3.31 |
| Pivot points | S3 | S2 | S1 | PP | R1 | R2 | R3 |
|---|---|---|---|---|---|---|---|
| Standard | 1.09 | 1.53 | 2.26 | 2.70 | 3.43 | 3.87 | 4.60 |
| Camarilla | 2.68 | 2.79 | 2.89 | 3.00 | 3.11 | 3.22 | 3.32 |
| Woodie | 1.25 | 1.60 | 2.42 | 2.77 | 3.59 | 3.94 | 4.76 |
| Fibonacci | 1.53 | 1.97 | 2.25 | 2.70 | 3.14 | 3.42 | 3.87 |
| Pivot points | S3 | S2 | S1 | PP | R1 | R2 | R3 |
|---|---|---|---|---|---|---|---|
| Standard | 0.68 | 1.03 | 1.52 | 1.87 | 2.36 | 2.71 | 3.20 |
| Camarilla | 1.77 | 1.85 | 1.92 | 2.00 | 2.08 | 2.15 | 2.23 |
| Woodie | 0.74 | 1.07 | 1.58 | 1.91 | 2.42 | 2.75 | 3.26 |
| Fibonacci | 1.03 | 1.35 | 1.55 | 1.87 | 2.19 | 2.39 | 2.71 |
Numerical data
The following is the status of the technical indicators and moving averages at the time of publication of this technical analysis:
| RSI (14): | 69.07 | |
| MACD (12,26,9): | 0.2700 | |
| Directional Movement: | 31.02 | |
| AROON (14): | 7.14 | |
| DEMA (21): | 2.53 | |
| Parabolic SAR (0,02-0,02-0,2): | 1.99 | |
| Elder Ray (13): | 0.65 | |
| Super Trend (3,10): | 1.86 | |
| Zig ZAG (10): | 3.08 | |
| VORTEX (21): | 1.1900 | |
| Stochastique (14,3,5): | 80.49 | |
| TEMA (21): | 2.72 | |
| Williams %R (14): | -13.51 | |
| Chande Momentum Oscillator (20): | 1.37 | |
| Repulse (5,40,3): | 17.6600 | |
| ROCnROLL: | 1 | |
| TRIX (15,9): | 1.1800 | |
| Courbe Coppock: | 107.62 |
| MA7: | 2.47 | |
| MA20: | 2.08 | |
| MA50: | 1.89 | |
| MA100: | 1.65 | |
| MAexp7: | 2.61 | |
| MAexp20: | 2.22 | |
| MAexp50: | 1.94 | |
| MAexp100: | 1.72 | |
| Price / MA7: | +25.51% | |
| Price / MA20: | +49.04% | |
| Price / MA50: | +64.02% | |
| Price / MA100: | +87.88% | |
| Price / MAexp7: | +18.77% | |
| Price / MAexp20: | +39.64% | |
| Price / MAexp50: | +59.79% | |
| Price / MAexp100: | +80.23% |
About author

Online


Add a comment
Comments
1 comments on the analysis API3 - API3/USDT - Daily