| Open: | - |
| Change: | - |
| Volume: | - |
| Low: | - |
| High: | - |
| High / Low range: | - |
| Type: | Cryptocurrencies |
| Ticker: | SOLUSD |
| ISIN: |
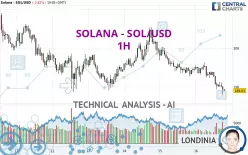
SOLANA - SOL/USD - 1H - Technical analysis published on 02/16/2025 (GMT)
- 160
- 0
- 02/16/2025 - 19:05
Click here for a new analysis!
- Timeframe : 1H
- - Analysis generated on 02/16/2025 - 19:05
- Status : LEVEL MAINTAINED

Summary of the analysis

Additional analysis
Quotes
SOLANA - SOL/USD rating 189.03 USD. On the day, this instrument lost -2.82% and was traded between 187.81 USD and 196.22 USD over the period. The price is currently at +0.65% from its lowest and -3.66% from its highest.The Central Gaps scanner detects a bearish opening. A small advantage for sellers in the very short term.
Bullish opening
Type : Bullish
Timeframe : Openning
Bearish opening
Type : Bearish
Timeframe : Openning
So that you have an overall view of the price change, here is a table showing the variations over several periods:
Technical
Technical analysis of SOLANA - SOL/USD in 1H shows a overall strongly bearish trend. 92.86% of the signals given by moving averages are bearish. This strongly bearish trend is supported by the strong bearish signals given by short-term moving averages. An assessment of moving averages reveals a bearish signal that could impact this trend:
Moving Average bearish crossovers : MA50 & MA100
Type : Bearish
Timeframe : 1 hour
In fact, according to the parameters integrated into the Central Analyzer system, 13 technical indicators out of 18 analysed are currently bearish. Caution: the Central Indicators scanner currently detects an excess:
CCI indicator is oversold : under -100
Type : Neutral
Timeframe : 1 hour
CCI indicator: bullish divergence
Type : Bullish
Timeframe : 1 hour
Williams %R indicator is oversold : under -80
Type : Neutral
Timeframe : 1 hour
Pivot points : price is over resistance 1
Type : Neutral
Timeframe : 1 hour
Pivot points : price is under support 1
Type : Neutral
Timeframe : 1 hour
Central Patterns, the scanner specializing in chart patterns, did not identify any signals.
The Central Candlesticks scanner which studies Japanese candlesticks did not detect anything.
| S3 | S2 | S1 | Price | R1 | R2 | R3 | |
|---|---|---|---|---|---|---|---|
| ProTrendLines | 139.06 | 158.12 | 180.14 | 189.03 | 189.07 | 193.68 | 196.53 |
| Change (%) | -26.43% | -16.35% | -4.70% | - | +0.02% | +2.46% | +3.97% |
| Change | -49.97 | -30.91 | -8.89 | - | +0.04 | +4.65 | +7.50 |
| Level | Minor | Intermediate | Intermediate | - | Intermediate | Intermediate | Minor |
Attention could also be paid to pivot points to set price objectives:
| Pivot points | S3 | S2 | S1 | PP | R1 | R2 | R3 |
|---|---|---|---|---|---|---|---|
| Standard | 183.64 | 188.15 | 191.33 | 195.84 | 199.02 | 203.53 | 206.71 |
| Camarilla | 192.41 | 193.11 | 193.82 | 194.52 | 195.23 | 195.93 | 196.64 |
| Woodie | 182.99 | 187.82 | 190.68 | 195.51 | 198.37 | 203.20 | 206.06 |
| Fibonacci | 188.15 | 191.08 | 192.90 | 195.84 | 198.77 | 200.59 | 203.53 |
| Pivot points | S3 | S2 | S1 | PP | R1 | R2 | R3 |
|---|---|---|---|---|---|---|---|
| Standard | 165.31 | 176.96 | 185.74 | 197.39 | 206.17 | 217.82 | 226.60 |
| Camarilla | 188.90 | 190.78 | 192.65 | 194.52 | 196.39 | 198.27 | 200.14 |
| Woodie | 163.88 | 176.24 | 184.31 | 196.67 | 204.74 | 217.10 | 225.17 |
| Fibonacci | 176.96 | 184.76 | 189.59 | 197.39 | 205.19 | 210.02 | 217.82 |
| Pivot points | S3 | S2 | S1 | PP | R1 | R2 | R3 |
|---|---|---|---|---|---|---|---|
| Standard | 43.17 | 106.24 | 168.97 | 232.04 | 294.77 | 357.84 | 420.57 |
| Camarilla | 197.12 | 208.65 | 220.18 | 231.71 | 243.24 | 254.77 | 266.31 |
| Woodie | 43.01 | 106.16 | 168.81 | 231.96 | 294.61 | 357.76 | 420.41 |
| Fibonacci | 106.24 | 154.29 | 183.98 | 232.04 | 280.09 | 309.78 | 357.84 |
Numerical data
The following is the status of the technical indicators and moving averages at the time of publication of this technical analysis:
| RSI (14): | 29.15 | |
| MACD (12,26,9): | -1.5300 | |
| Directional Movement: | -27.99 | |
| AROON (14): | -85.72 | |
| DEMA (21): | 190.19 | |
| Parabolic SAR (0,02-0,02-0,2): | 192.99 | |
| Elder Ray (13): | -1.98 | |
| Super Trend (3,10): | 193.31 | |
| Zig ZAG (10): | 189.14 | |
| VORTEX (21): | 0.8400 | |
| Stochastique (14,3,5): | 15.09 | |
| TEMA (21): | 189.47 | |
| Williams %R (14): | -83.47 | |
| Chande Momentum Oscillator (20): | -3.75 | |
| Repulse (5,40,3): | -0.4600 | |
| ROCnROLL: | 2 | |
| TRIX (15,9): | -0.0900 | |
| Courbe Coppock: | 4.31 |
| MA7: | 196.09 | |
| MA20: | 205.75 | |
| MA50: | 212.19 | |
| MA100: | 216.88 | |
| MAexp7: | 190.22 | |
| MAexp20: | 192.06 | |
| MAexp50: | 194.01 | |
| MAexp100: | 195.24 | |
| Price / MA7: | -3.60% | |
| Price / MA20: | -8.13% | |
| Price / MA50: | -10.91% | |
| Price / MA100: | -12.84% | |
| Price / MAexp7: | -0.63% | |
| Price / MAexp20: | -1.58% | |
| Price / MAexp50: | -2.57% | |
| Price / MAexp100: | -3.18% |
About author

Online


Add a comment
Comments
0 comments on the analysis SOLANA - SOL/USD - 1H