SOLANA - SOL/USD - 1H - Technical analysis published on 01/01/2025 (GMT)
- 219
- 0
Click here for a new analysis!
- Timeframe : 1H
- - Analysis generated on
- Status : INVALID
Summary of the analysis

Additional analysis
Quotes
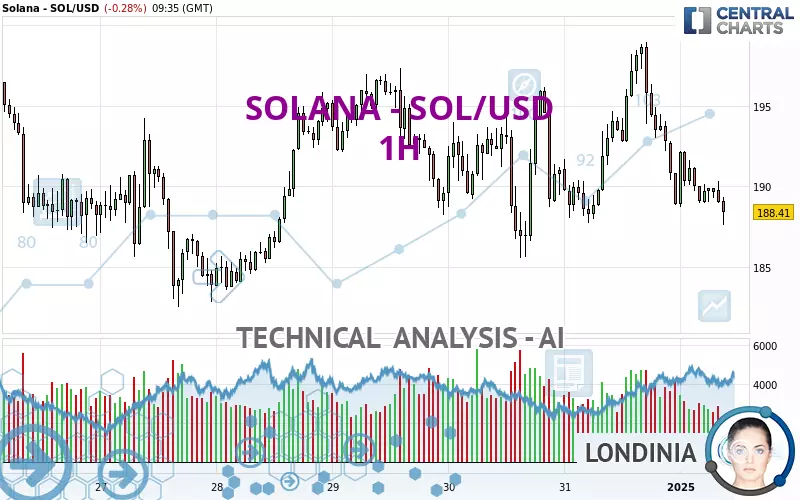
The SOLANA - SOL/USD rating is 188.43 USD. The price is lower by -0.27% since the last closing and was traded between 187.63 USD and 192.22 USD over the period. The price is currently at +0.43% from its lowest and -1.97% from its highest.A bearish opening was detected by the Central Gaps scanner. Sellers are trying to impose a bearish trend in the very short term.
Bearish opening
Type : Bearish
Timeframe : Openning
So that you have an overall view of the price change, here is a table showing the variations over several periods:
Near a new HIGH record (1st january)
Type : Bullish
Timeframe : Weekly
Technical
A technical analysis in 1H of this SOLANA - SOL/USD chart shows a bearish trend. 71.43% of the signals given by moving averages are bearish. This bearish trend is supported by the strong bearish signals given by short-term moving averages. The Central Indicators market scanner currently does not detect any result that concerns moving averages.
The probability of a further decline is moderate given the direction of the technical indicators.
But beware of excesses. The Central Indicators scanner currently detects this:
Williams %R indicator is oversold : under -80
Type : Neutral
Timeframe : 1 hour
Price is back under the pivot point
Type : Bearish
Timeframe : Weekly
The analysis of the price chart with Central Patterns scanners does not return any result.
From the Japanese candlestick perspective, the Central Candlesticks scanner notes the presence of these results that could impact the short-term trend:
Bullish harami
Type : Bullish
Timeframe : 1 hour
Bullish harami cross
Type : Bullish
Timeframe : 1 hour
Three black crows
Type : Bearish
Timeframe : 1 hour
| S3 | S2 | S1 | Price | R1 | R2 | R3 | |
|---|---|---|---|---|---|---|---|
| ProTrendLines | 182.54 | 184.83 | 187.75 | 188.43 | 192.14 | 194.28 | 198.90 |
| Change (%) | -3.13% | -1.91% | -0.36% | - | +1.97% | +3.10% | +5.56% |
| Change | -5.89 | -3.60 | -0.68 | - | +3.71 | +5.85 | +10.47 |
| Level | Minor | Major | Minor | - | Minor | Intermediate | Intermediate |
Attention could also be paid to pivot points to set price objectives:
| Pivot points | S3 | S2 | S1 | PP | R1 | R2 | R3 |
|---|---|---|---|---|---|---|---|
| Standard | 173.62 | 180.69 | 184.81 | 191.88 | 196.00 | 203.07 | 207.19 |
| Camarilla | 185.86 | 186.89 | 187.91 | 188.94 | 189.97 | 190.99 | 192.02 |
| Woodie | 172.16 | 179.95 | 183.35 | 191.14 | 194.54 | 202.33 | 205.73 |
| Fibonacci | 180.69 | 184.96 | 187.60 | 191.88 | 196.15 | 198.79 | 203.07 |
| Pivot points | S3 | S2 | S1 | PP | R1 | R2 | R3 |
|---|---|---|---|---|---|---|---|
| Standard | 155.21 | 165.81 | 180.48 | 191.08 | 205.75 | 216.35 | 231.02 |
| Camarilla | 188.20 | 190.52 | 192.83 | 195.15 | 197.47 | 199.78 | 202.10 |
| Woodie | 157.25 | 166.83 | 182.52 | 192.10 | 207.79 | 217.37 | 233.06 |
| Fibonacci | 165.81 | 175.46 | 181.43 | 191.08 | 200.73 | 206.70 | 216.35 |
| Pivot points | S3 | S2 | S1 | PP | R1 | R2 | R3 |
|---|---|---|---|---|---|---|---|
| Standard | 88.42 | 131.79 | 160.36 | 203.73 | 232.30 | 275.67 | 304.24 |
| Camarilla | 169.16 | 175.75 | 182.35 | 188.94 | 195.54 | 202.13 | 208.72 |
| Woodie | 81.03 | 128.09 | 152.97 | 200.03 | 224.91 | 271.97 | 296.85 |
| Fibonacci | 131.79 | 159.27 | 176.25 | 203.73 | 231.21 | 248.19 | 275.67 |
Numerical data
The following is the status of the technical indicators and moving averages at the time of publication of this technical analysis:
| RSI (14): | 42.45 | |
| MACD (12,26,9): | -0.9000 | |
| Directional Movement: | -7.31 | |
| AROON (14): | -35.71 | |
| DEMA (21): | 189.91 | |
| Parabolic SAR (0,02-0,02-0,2): | 193.04 | |
| Elder Ray (13): | -1.48 | |
| Super Trend (3,10): | 193.76 | |
| Zig ZAG (10): | 188.23 | |
| VORTEX (21): | 0.8900 | |
| Stochastique (14,3,5): | 6.63 | |
| TEMA (21): | 188.85 | |
| Williams %R (14): | -98.74 | |
| Chande Momentum Oscillator (20): | -4.60 | |
| Repulse (5,40,3): | -1.2700 | |
| ROCnROLL: | 2 | |
| TRIX (15,9): | -0.0400 | |
| Courbe Coppock: | 5.52 |
| MA7: | 189.28 | |
| MA20: | 198.73 | |
| MA50: | 219.86 | |
| MA100: | 191.74 | |
| MAexp7: | 189.43 | |
| MAexp20: | 190.96 | |
| MAexp50: | 191.55 | |
| MAexp100: | 191.33 | |
| Price / MA7: | -0.45% | |
| Price / MA20: | -5.18% | |
| Price / MA50: | -14.30% | |
| Price / MA100: | -1.73% | |
| Price / MAexp7: | -0.53% | |
| Price / MAexp20: | -1.32% | |
| Price / MAexp50: | -1.63% | |
| Price / MAexp100: | -1.52% |
About author
Online


Add a comment
Comments
0 comments on the analysis SOLANA - SOL/USD - 1H