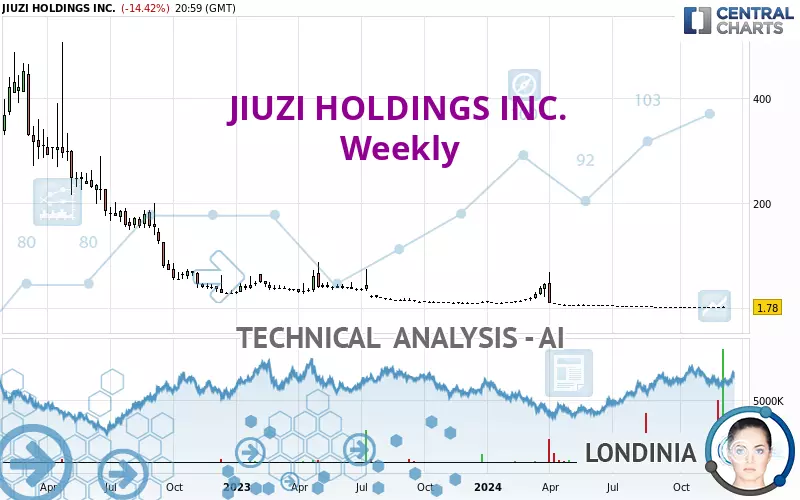
JIUZI HOLDINGS INC. - Weekly - Technical analysis published on 12/14/2024 (GMT)
- 139
- 0
Click here for a new analysis!
- Timeframe : Weekly
- - Analysis generated on
- Status : TARGET REACHED
Summary of the analysis

Additional analysis
Quotes
The JIUZI HOLDINGS INC. rating is 1.78 USD. The price registered an increase of +50.85% over 5 days with the lowest point at 1.05 USD and the highest point at 2.25 USD. The deviation from the price is +69.52% for the low point and -20.89% for the high point.A bearish opening was detected by the Central Gaps scanner. Sellers are trying to impose a bearish trend in the very short term.
Bearish opening
Type : Bearish
Timeframe : Openning
So that you have an overall view of the price change, here is a table showing the variations over several periods:
Near a new LOW record (5 years)
Type : Bearish
Timeframe : Weekly
New HIGH record (1 month)
Type : Bullish
Timeframe : Weekly
Abnormal volumes on JIUZI HOLDINGS INC. were detected by the Central Volumes scanner:
Abnormal volumes
Timeframe : 5 days
Abnormal volumes
Timeframe : 20 days
Abnormal volumes
Timeframe : 50 days
Technical
A technical analysis in Weekly of this JIUZI HOLDINGS INC. chart shows a sharp bearish trend. 82.14% of the signals given by moving averages are bearish. Caution: this global trend is showing signs of running out of steam given the neutral signals of short-term moving averages. An assessment of moving averages reveals a bullish signal that could impact this trend:
Bullish price crossover with Moving Average 20
Type : Bullish
Timeframe : Weekly
In fact, 11 technical indicators on 18 studied are currently positioned bullish. Central Indicators, the scanner specialised in technical indicators, has identified these signals:
Pivot points : price is over resistance 2
Type : Neutral
Timeframe : Weekly
Parabolic SAR indicator bearish reversal
Type : Bearish
Timeframe : Weekly
Momentum indicator is back over 0
Type : Bullish
Timeframe : Weekly
Williams %R indicator is back over -50
Type : Bullish
Timeframe : Weekly
No signals are given by Central Patterns, a market scanner specialised in chart patterns, resistances and supports.
The presence of a bullish Japanese candlestick pattern detected by Central Candlesticks that could cause a very short term rebound was also detected:
Bullish engulfing lines
Type : Bullish
Timeframe : Weekly
| S1 | Price | R1 | R2 | R3 | |
|---|---|---|---|---|---|
| ProTrendLines | 1.03 | 1.78 | 54.84 | 308.88 | 472.68 |
| Change (%) | -42.13% | - | +2,980.90% | +17,252.81% | +26,455.06% |
| Change | -0.75 | - | +53.06 | +307.10 | +470.90 |
| Level | Intermediate | - | Intermediate | Minor | Major |
To determine price objectives, it is also possible to use the pivot points. Here is the price position in relation to pivot points:
| Pivot points | S3 | S2 | S1 | PP | R1 | R2 | R3 |
|---|---|---|---|---|---|---|---|
| Standard | 0.74 | 1.13 | 1.46 | 1.85 | 2.18 | 2.57 | 2.90 |
| Camarilla | 1.58 | 1.65 | 1.71 | 1.78 | 1.85 | 1.91 | 1.98 |
| Woodie | 0.70 | 1.12 | 1.42 | 1.84 | 2.14 | 2.56 | 2.86 |
| Fibonacci | 1.13 | 1.41 | 1.58 | 1.85 | 2.13 | 2.30 | 2.57 |
| Pivot points | S3 | S2 | S1 | PP | R1 | R2 | R3 |
|---|---|---|---|---|---|---|---|
| Standard | 0.66 | 0.92 | 1.05 | 1.31 | 1.44 | 1.70 | 1.83 |
| Camarilla | 1.07 | 1.11 | 1.14 | 1.18 | 1.22 | 1.25 | 1.29 |
| Woodie | 0.60 | 0.89 | 0.99 | 1.28 | 1.38 | 1.67 | 1.77 |
| Fibonacci | 0.92 | 1.07 | 1.16 | 1.31 | 1.46 | 1.55 | 1.70 |
| Pivot points | S3 | S2 | S1 | PP | R1 | R2 | R3 |
|---|---|---|---|---|---|---|---|
| Standard | 0.72 | 0.99 | 1.13 | 1.40 | 1.54 | 1.81 | 1.95 |
| Camarilla | 1.16 | 1.20 | 1.23 | 1.27 | 1.31 | 1.35 | 1.38 |
| Woodie | 0.66 | 0.96 | 1.07 | 1.37 | 1.48 | 1.78 | 1.89 |
| Fibonacci | 0.99 | 1.15 | 1.24 | 1.40 | 1.56 | 1.65 | 1.81 |
Numerical data
The following is the status of technical indicators and moving averages registered at the time this technical analysis was created:
| RSI (14): | 44.58 | |
| MACD (12,26,9): | -1.3100 | |
| Directional Movement: | 21.38 | |
| AROON (14): | 100.00 | |
| DEMA (21): | 0.16 | |
| Parabolic SAR (0,02-0,02-0,2): | 1.85 | |
| Elder Ray (13): | -0.07 | |
| Super Trend (3,10): | 3.68 | |
| Zig ZAG (10): | 2.08 | |
| VORTEX (21): | 0.8800 | |
| Stochastique (14,3,5): | 44.19 | |
| TEMA (21): | 1.25 | |
| Williams %R (14): | -5.36 | |
| Chande Momentum Oscillator (20): | 0.62 | |
| Repulse (5,40,3): | 34.4200 | |
| ROCnROLL: | -1 | |
| TRIX (15,9): | -5.2800 | |
| Courbe Coppock: | 10.93 |
| MA7: | 1.45 | |
| MA20: | 1.37 | |
| MA50: | 1.43 | |
| MA100: | 1.62 | |
| MAexp7: | 1.52 | |
| MAexp20: | 2.21 | |
| MAexp50: | 10.23 | |
| MAexp100: | 81.17 | |
| Price / MA7: | +22.76% | |
| Price / MA20: | +29.93% | |
| Price / MA50: | +24.48% | |
| Price / MA100: | +9.88% | |
| Price / MAexp7: | +17.11% | |
| Price / MAexp20: | -19.46% | |
| Price / MAexp50: | -82.60% | |
| Price / MAexp100: | -97.81% |
About author

Online


Add a comment
Comments
0 comments on the analysis JIUZI HOLDINGS INC. - Weekly