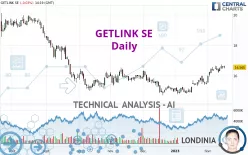
GETLINK SE - Daily - Technical analysis published on 02/16/2023 (GMT)
- 275
- 0
Click here for a new analysis!
- Timeframe : Daily
- - Analysis generated on
- Status : INVALID

Summary of the analysis

Additional analysis
Quotes
The GETLINK SE rating is 16.565 EUR. The price is lower by -0.03% since the last closing and was traded between 16.475 EUR and 16.655 EUR over the period. The price is currently at +0.55% from its lowest and -0.54% from its highest.The Central Gaps scanner detects a bullish opening. A small advantage for buyers in the very short term.
Bullish opening
Type : Bullish
Timeframe : Openning
Here is a more detailed summary of the historical variations registered by GETLINK SE:
Near a new HIGH record (1st january)
Type : Bullish
Timeframe : Weekly
Near a new HIGH record (1 month)
Type : Bullish
Timeframe : Weekly
Technical
Technical analysis of this Daily chart of GETLINK SE indicates that the overall trend is strongly bullish. 85.71% of the signals given by moving averages are bullish. The overall trend is supported by the strong bullish signals from short-term moving averages. There is no crossing of moving average by the price or crossing of moving averages between themselves.
Technical indicators are strongly bullish, suggesting that the price increase should continue.
Caution: the Central Indicators scanner currently detects an excess:
Williams %R indicator is overbought : over -20
Type : Neutral
Timeframe : Daily
Price is back over the pivot point
Type : Bullish
Timeframe : Weekly
Price is back under the pivot point
Type : Bearish
Timeframe : Daily
An analysis of the price chart with the Central Patterns scanner (detector of chart patterns and resistances and supports) shows several results that can have an impact on the price change:
Near horizontal resistance
Type : Bearish
Timeframe : Daily
Near resistance of channel
Type : Bearish
Timeframe : Daily
No result was found by the Central Candlesticks scanner on Japanese candlesticks.
| S3 | S2 | S1 | Price | R1 | R2 | R3 | |
|---|---|---|---|---|---|---|---|
| ProTrendLines | 12.820 | 14.861 | 16.040 | 16.565 | 16.761 | 17.685 | 18.593 |
| Change (%) | -22.61% | -10.29% | -3.17% | - | +1.18% | +6.76% | +12.24% |
| Change | -3.745 | -1.704 | -0.525 | - | +0.196 | +1.120 | +2.028 |
| Level | Major | Major | Minor | - | Major | Minor | Intermediate |
Attention could also be paid to pivot points to set price objectives:
| Pivot points | S3 | S2 | S1 | PP | R1 | R2 | R3 |
|---|---|---|---|---|---|---|---|
| Standard | 16.300 | 16.380 | 16.475 | 16.555 | 16.650 | 16.730 | 16.825 |
| Camarilla | 16.522 | 16.538 | 16.554 | 16.570 | 16.586 | 16.602 | 16.618 |
| Woodie | 16.308 | 16.384 | 16.483 | 16.559 | 16.658 | 16.734 | 16.833 |
| Fibonacci | 16.380 | 16.447 | 16.488 | 16.555 | 16.622 | 16.663 | 16.730 |
| Pivot points | S3 | S2 | S1 | PP | R1 | R2 | R3 |
|---|---|---|---|---|---|---|---|
| Standard | 15.622 | 15.908 | 16.097 | 16.383 | 16.572 | 16.858 | 17.047 |
| Camarilla | 16.154 | 16.198 | 16.242 | 16.285 | 16.329 | 16.372 | 16.416 |
| Woodie | 15.573 | 15.884 | 16.048 | 16.359 | 16.523 | 16.834 | 16.998 |
| Fibonacci | 15.908 | 16.090 | 16.202 | 16.383 | 16.565 | 16.677 | 16.858 |
| Pivot points | S3 | S2 | S1 | PP | R1 | R2 | R3 |
|---|---|---|---|---|---|---|---|
| Standard | 13.678 | 14.237 | 14.883 | 15.442 | 16.088 | 16.647 | 17.293 |
| Camarilla | 15.199 | 15.309 | 15.420 | 15.530 | 15.641 | 15.751 | 15.861 |
| Woodie | 13.723 | 14.259 | 14.928 | 15.464 | 16.133 | 16.669 | 17.338 |
| Fibonacci | 14.237 | 14.697 | 14.981 | 15.442 | 15.902 | 16.186 | 16.647 |
Numerical data
The following is the status of technical indicators and moving averages registered at the time this technical analysis was created:
| RSI (14): | 66.62 | |
| MACD (12,26,9): | 0.3100 | |
| Directional Movement: | 17.231 | |
| AROON (14): | 78.571 | |
| DEMA (21): | 16.516 | |
| Parabolic SAR (0,02-0,02-0,2): | 16.216 | |
| Elder Ray (13): | 0.263 | |
| Super Trend (3,10): | 15.808 | |
| Zig ZAG (10): | 16.525 | |
| VORTEX (21): | 1.1670 | |
| Stochastique (14,3,5): | 87.85 | |
| TEMA (21): | 16.722 | |
| Williams %R (14): | -13.91 | |
| Chande Momentum Oscillator (20): | 1.020 | |
| Repulse (5,40,3): | -0.2370 | |
| ROCnROLL: | 1 | |
| TRIX (15,9): | 0.2660 | |
| Courbe Coppock: | 10.89 |
| MA7: | 16.479 | |
| MA20: | 16.084 | |
| MA50: | 15.545 | |
| MA100: | 15.674 | |
| MAexp7: | 16.467 | |
| MAexp20: | 16.130 | |
| MAexp50: | 15.846 | |
| MAexp100: | 16.000 | |
| Price / MA7: | +0.52% | |
| Price / MA20: | +2.99% | |
| Price / MA50: | +6.56% | |
| Price / MA100: | +5.68% | |
| Price / MAexp7: | +0.60% | |
| Price / MAexp20: | +2.70% | |
| Price / MAexp50: | +4.54% | |
| Price / MAexp100: | +3.53% |
News
The latest news and videos published on GETLINK SE at the time of the analysis were as follows:
- Getlink SE: Shuttle Traffic in January 2023
- Getlink: Half-yearly Report on the Liquidity Contract
- Getlink: The Channel Tunnel Is at the Forefront of Rail Power Technology and Is Increasing Its Transport Capacity
- Getlink: All-Time High Revenue for the Group at €1.6 Billion
- GETLINK S.E.: Information Relating to the Total Number of Shares and Voting Rights Which Form the Share Capital (Articles L. 233-8 Ii of the French Commercial Code and 223-16 of the French General Regulation of the AMF)
About author
Online


Add a comment
Comments
0 comments on the analysis GETLINK SE - Daily