VEON - Daily - Technical analysis published on 02/21/2024 (GMT)
- 163
- 0
Click here for a new analysis!
- Timeframe : Daily
- - Analysis generated on
- Status : TARGET REACHED

Summary of the analysis
Additional analysis
Quotes
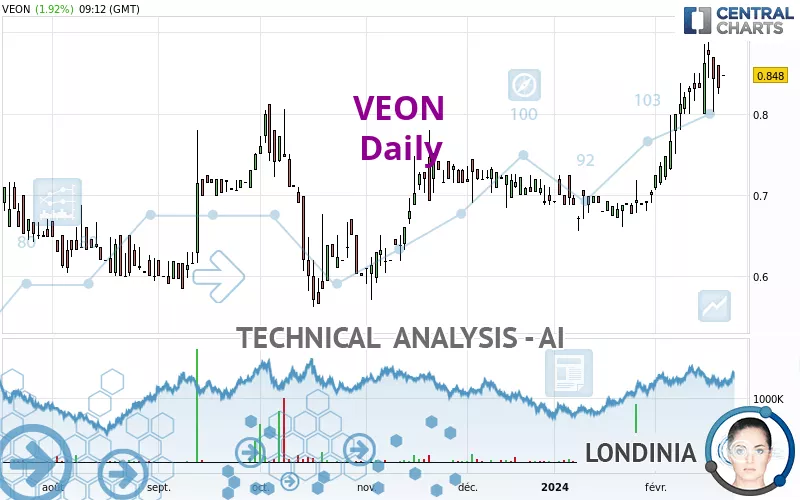
The VEON price is 0.848 EUR. The price registered an increase of +1.92% on the session with the lowest point at 0.848 EUR and the highest point at 0.848 EUR. The deviation from the price is 0% for the low point and 0% for the high point.A bullish opening was detected by the Central Gaps scanner. Buyers are trying to impose a bullish momentum in the very short term.
Bullish opening
Type : Bullish
Timeframe : Openning
Here is a more detailed summary of the historical variations registered by VEON:
Near a new HIGH record (1 year)
Type : Bullish
Timeframe : Weekly
Near a new HIGH record (1st january)
Type : Bullish
Timeframe : Weekly
Near a new HIGH record (1 month)
Type : Bullish
Timeframe : Weekly
Technical
Technical analysis of VEON in Daily shows a strongly overall bullish trend. 92.86% of the signals given by moving averages are bullish. The overall trend is supported by the strong bullish signals from short-term moving averages. The Central Indicators scanner does not detect any result on moving averages that would impact this trend.
In fact, 12 technical indicators on 18 studied are currently positioned bullish. The Central Indicators scanner found this result concerning these indicators:
Price is back under the pivot point
Type : Bearish
Timeframe : Weekly
The analysis of the price chart with Central Patterns scanners does not return any result.
Central Candlesticks, the scanner specialised in Japanese candlesticks, detects these signals that could have an impact on the current short-term trend:
Bullish harami cross
Type : Bullish
Timeframe : Daily
Doji
Type : Neutral
Timeframe : Daily
| S3 | S2 | S1 | Price | R1 | R2 | R3 | |
|---|---|---|---|---|---|---|---|
| ProTrendLines | 0.719 | 0.749 | 0.800 | 0.848 | 0.966 | 1.350 | 1.564 |
| Change (%) | -15.21% | -11.67% | -5.66% | - | +13.92% | +59.20% | +84.43% |
| Change | -0.129 | -0.099 | -0.048 | - | +0.118 | +0.502 | +0.716 |
| Level | Intermediate | Intermediate | Intermediate | - | Minor | Minor | Minor |
To determine price objectives, it is also possible to use the pivot points. Here is the price position in relation to pivot points:
| Pivot points | S3 | S2 | S1 | PP | R1 | R2 | R3 |
|---|---|---|---|---|---|---|---|
| Standard | 0.781 | 0.803 | 0.817 | 0.839 | 0.853 | 0.875 | 0.889 |
| Camarilla | 0.822 | 0.825 | 0.829 | 0.832 | 0.835 | 0.839 | 0.842 |
| Woodie | 0.778 | 0.801 | 0.814 | 0.837 | 0.850 | 0.873 | 0.886 |
| Fibonacci | 0.803 | 0.816 | 0.825 | 0.839 | 0.852 | 0.861 | 0.875 |
| Pivot points | S3 | S2 | S1 | PP | R1 | R2 | R3 |
|---|---|---|---|---|---|---|---|
| Standard | 0.731 | 0.765 | 0.819 | 0.853 | 0.907 | 0.941 | 0.995 |
| Camarilla | 0.848 | 0.856 | 0.864 | 0.872 | 0.880 | 0.888 | 0.896 |
| Woodie | 0.740 | 0.770 | 0.828 | 0.858 | 0.916 | 0.946 | 1.004 |
| Fibonacci | 0.765 | 0.799 | 0.820 | 0.853 | 0.887 | 0.908 | 0.941 |
| Pivot points | S3 | S2 | S1 | PP | R1 | R2 | R3 |
|---|---|---|---|---|---|---|---|
| Standard | 0.597 | 0.627 | 0.665 | 0.695 | 0.733 | 0.763 | 0.801 |
| Camarilla | 0.685 | 0.692 | 0.698 | 0.704 | 0.710 | 0.717 | 0.723 |
| Woodie | 0.602 | 0.629 | 0.670 | 0.697 | 0.738 | 0.765 | 0.806 |
| Fibonacci | 0.627 | 0.653 | 0.669 | 0.695 | 0.721 | 0.737 | 0.763 |
Numerical data
The following are the details of the technical indicators and moving averages that were collected to generate this technical analysis:
| RSI (14): | 69.75 | |
| MACD (12,26,9): | 0.0400 | |
| Directional Movement: | 15.106 | |
| AROON (14): | 78.571 | |
| DEMA (21): | 0.845 | |
| Parabolic SAR (0,02-0,02-0,2): | 0.802 | |
| Elder Ray (13): | 0.030 | |
| Super Trend (3,10): | 0.757 | |
| Zig ZAG (10): | 0.848 | |
| VORTEX (21): | 1.2250 | |
| Stochastique (14,3,5): | 74.42 | |
| TEMA (21): | 0.868 | |
| Williams %R (14): | -22.73 | |
| Chande Momentum Oscillator (20): | 0.100 | |
| Repulse (5,40,3): | -1.3030 | |
| ROCnROLL: | 1 | |
| TRIX (15,9): | 0.6880 | |
| Courbe Coppock: | 37.52 |
| MA7: | 0.845 | |
| MA20: | 0.781 | |
| MA50: | 0.733 | |
| MA100: | 0.706 | |
| MAexp7: | 0.839 | |
| MAexp20: | 0.796 | |
| MAexp50: | 0.749 | |
| MAexp100: | 0.720 | |
| Price / MA7: | +0.36% | |
| Price / MA20: | +8.58% | |
| Price / MA50: | +15.69% | |
| Price / MA100: | +20.11% | |
| Price / MAexp7: | +1.07% | |
| Price / MAexp20: | +6.53% | |
| Price / MAexp50: | +13.22% | |
| Price / MAexp100: | +17.78% |
News
Don't forget to follow the news on VEON. At the time of publication of this analysis, the latest news was as follows:
- VEON Launches Geolocation Gateway, Enabling Proximity-Based Digital Services
- VEON to release 4Q 2023 trading update on 21 March 2024
- Kyivstar and Come Back Alive Raise UAH180M to Demine Ukraine, Reaching Campaign Target
- VEON’s Kyivstar Nominated for the GLOMO in “Best Mobile Innovation” for Emergency and Humanitarian Connectivity
- Augmented Intelligence for Disaster Response: Beeline Kazakhstan Mobilises AI to Fight Forest Fires
About author

Online


Add a comment
Comments
0 comments on the analysis VEON - Daily