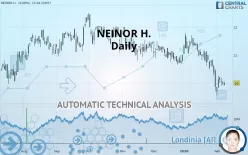
NEINOR H. - Daily - Technical analysis published on 02/10/2020 (GMT)
- 237
- 0
- Who voted?
Click here for a new analysis!
- Timeframe : Daily
- - Analysis generated on
- Status : TARGET REACHED

Summary of the analysis

Additional analysis
Quotes
NEINOR H. rating 10.000 EUR. The price registered an increase of +0.00% on the session with the lowest point at 9.915 EUR and the highest point at 10.050 EUR. The deviation from the price is +0.86% for the low point and -0.50% for the high point.The Central Gaps scanner detects the formation of a bearish gap marking the strong presence of sellers ahead of buyers at the opening. This formed a quotation gap.
Opening Gap DOWN
Type : Bearish
Timeframe : Openning
So that you have an overall view of the price change, here is a table showing the variations over several periods:
Near a new LOW record (1st january)
Type : Bearish
Timeframe : Weekly
Near a new LOW record (1 month)
Type : Bearish
Timeframe : Weekly
Technical
Technical analysis of this Daily chart of NEINOR H. indicates that the overall trend is strongly bearish. The signals given by moving averages are 92.86% bearish. This strong bearish trend is confirmed by the strong signals currently being given by short-term moving averages. The Central Indicators scanner does not detect any result on moving averages that would impact this trend.
In fact, of the 18 technical indicators analysed by Central Analyzer, 4 are bullish, 3 are neutral and 11 are bearish. Caution: the Central Indicators scanner currently detects an excess:
CCI indicator is oversold : under -100
Type : Neutral
Timeframe : Daily
CCI indicator: bullish divergence
Type : Bullish
Timeframe : Daily
Price is back over the pivot point
Type : Bullish
Timeframe : Weekly
No signals are given by Central Patterns, a market scanner specialised in chart patterns, resistances and supports.
The Central Candlesticks scanner, specialised in Japanese candlesticks, did not identify any signals.
| S2 | S1 | Price | R1 | R2 | R3 | |
|---|---|---|---|---|---|---|
| ProTrendLines | 8.985 | 9.850 | 10.000 | 10.070 | 10.776 | 11.342 |
| Change (%) | -10.15% | -1.50% | - | +0.70% | +7.76% | +13.42% |
| Change | -1.015 | -0.150 | - | +0.070 | +0.776 | +1.342 |
| Level | Intermediate | Major | - | Major | Intermediate | Major |
To determine price objectives, it is also possible to use the pivot points. Here is the price position in relation to pivot points:
| Pivot points | S3 | S2 | S1 | PP | R1 | R2 | R3 |
|---|---|---|---|---|---|---|---|
| Standard | 9.803 | 9.867 | 9.933 | 9.997 | 10.063 | 10.127 | 10.193 |
| Camarilla | 9.964 | 9.976 | 9.988 | 10.000 | 10.012 | 10.024 | 10.036 |
| Woodie | 9.805 | 9.868 | 9.935 | 9.998 | 10.065 | 10.128 | 10.195 |
| Fibonacci | 9.867 | 9.916 | 9.947 | 9.997 | 10.046 | 10.077 | 10.127 |
| Pivot points | S3 | S2 | S1 | PP | R1 | R2 | R3 |
|---|---|---|---|---|---|---|---|
| Standard | 8.928 | 9.247 | 9.623 | 9.942 | 10.318 | 10.637 | 11.013 |
| Camarilla | 9.809 | 9.873 | 9.936 | 10.000 | 10.064 | 10.127 | 10.191 |
| Woodie | 8.958 | 9.261 | 9.653 | 9.956 | 10.348 | 10.651 | 11.043 |
| Fibonacci | 9.247 | 9.512 | 9.676 | 9.942 | 10.207 | 10.371 | 10.637 |
| Pivot points | S3 | S2 | S1 | PP | R1 | R2 | R3 |
|---|---|---|---|---|---|---|---|
| Standard | 7.020 | 8.360 | 9.110 | 10.450 | 11.200 | 12.540 | 13.290 |
| Camarilla | 9.285 | 9.477 | 9.668 | 9.860 | 10.052 | 10.243 | 10.435 |
| Woodie | 6.725 | 8.213 | 8.815 | 10.303 | 10.905 | 12.393 | 12.995 |
| Fibonacci | 8.360 | 9.158 | 9.652 | 10.450 | 11.248 | 11.742 | 12.540 |
Numerical data
The following is the status of technical indicators and moving averages registered at the time this technical analysis was created:
| RSI (14): | 34.27 | |
| MACD (12,26,9): | -0.3060 | |
| Directional Movement: | -17.268 | |
| AROON (14): | -57.143 | |
| DEMA (21): | 10.096 | |
| Parabolic SAR (0,02-0,02-0,2): | 10.246 | |
| Elder Ray (13): | -0.313 | |
| Super Trend (3,10): | 10.733 | |
| Zig ZAG (10): | 10.000 | |
| VORTEX (21): | 0.7490 | |
| Stochastique (14,3,5): | 28.32 | |
| TEMA (21): | 9.916 | |
| Williams %R (14): | -72.73 | |
| Chande Momentum Oscillator (20): | -0.750 | |
| Repulse (5,40,3): | 1.1260 | |
| ROCnROLL: | 2 | |
| TRIX (15,9): | -0.3180 | |
| Courbe Coppock: | 17.55 |
| MA7: | 10.013 | |
| MA20: | 10.582 | |
| MA50: | 10.926 | |
| MA100: | 11.273 | |
| MAexp7: | 10.114 | |
| MAexp20: | 10.465 | |
| MAexp50: | 10.833 | |
| MAexp100: | 11.053 | |
| Price / MA7: | -0.13% | |
| Price / MA20: | -5.50% | |
| Price / MA50: | -8.48% | |
| Price / MA100: | -11.29% | |
| Price / MAexp7: | -1.13% | |
| Price / MAexp20: | -4.44% | |
| Price / MAexp50: | -7.69% | |
| Price / MAexp100: | -9.53% |
About author

Online


Add a comment
Comments
0 comments on the analysis NEINOR H. - Daily