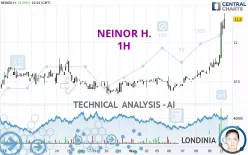
NEINOR H. - 1H - Technical analysis published on 02/12/2024 (GMT)
- 119
- 0
Click here for a new analysis!
- Timeframe : 1H
- - Analysis generated on
- Status : INVALID

Summary of the analysis

Additional analysis
Quotes
The NEINOR H. rating is 11.32 EUR. The price has increased by +4.43% since the last closing and was between 10.80 EUR and 11.32 EUR. This implies that the price is at +4.81% from its lowest and at 0% from its highest.The Central Gaps scanner detects a bearish opening marking the presence of sellers ahead of buyers at the opening but not sufficiently marked to allow the price to register a quotation gap.
Bearish opening
Type : Bearish
Timeframe : Openning
Here is a more detailed summary of the historical variations registered by NEINOR H.:
New HIGH record (1 year)
Type : Bullish
Timeframe : Weekly
New HIGH record (1st january)
Type : Bullish
Timeframe : Weekly
New HIGH record (1 month)
Type : Bullish
Timeframe : Weekly
Technical
A technical analysis in 1H of this NEINOR H. chart shows a strongly bullish trend. 92.86% of the signals given by moving averages are bullish. This strongly bullish trend is supported by the strong bullish signals given by short-term moving averages. The Central Indicators scanner does not detect any result on moving averages that would impact this trend.
In fact, according to the parameters integrated into the Central Analyzer system, 17 technical indicators out of 18 analysed are currently bullish. Caution: the Central Indicators scanner currently detects an excess:
RSI indicator is overbought : over 80
Type : Neutral
Timeframe : 1 hour
CCI indicator is overbought : over 100
Type : Neutral
Timeframe : 1 hour
Previous candle closed over Bollinger bands
Type : Neutral
Timeframe : 1 hour
Williams %R indicator is overbought : over -20
Type : Neutral
Timeframe : 1 hour
Pivot points : price is over resistance 2
Type : Neutral
Timeframe : Weekly
Pivot points : price is over resistance 3
Type : Neutral
Timeframe : 1 hour
Central Patterns, the market scanner focusing on chart patterns, resistances and supports found these results:
Near horizontal resistance
Type : Bearish
Timeframe : 1 hour
Resistance of channel is broken
Type : Bullish
Timeframe : 1 hour
No result was found by the Central Candlesticks scanner on Japanese candlesticks.
| S3 | S2 | S1 | Price | R1 | R2 | |
|---|---|---|---|---|---|---|
| ProTrendLines | 10.68 | 10.84 | 11.04 | 11.32 | 11.44 | 11.90 |
| Change (%) | -5.65% | -4.24% | -2.47% | - | +1.06% | +5.12% |
| Change | -0.64 | -0.48 | -0.28 | - | +0.12 | +0.58 |
| Level | Intermediate | Major | Intermediate | - | Major | Minor |
To determine price objectives, it is also possible to use the pivot points. Here is the price position in relation to pivot points:
| Pivot points | S3 | S2 | S1 | PP | R1 | R2 | R3 |
|---|---|---|---|---|---|---|---|
| Standard | 10.44 | 10.52 | 10.68 | 10.76 | 10.92 | 11.00 | 11.16 |
| Camarilla | 10.77 | 10.80 | 10.82 | 10.84 | 10.86 | 10.88 | 10.91 |
| Woodie | 10.48 | 10.54 | 10.72 | 10.78 | 10.96 | 11.02 | 11.20 |
| Fibonacci | 10.52 | 10.61 | 10.67 | 10.76 | 10.85 | 10.91 | 11.00 |
| Pivot points | S3 | S2 | S1 | PP | R1 | R2 | R3 |
|---|---|---|---|---|---|---|---|
| Standard | 10.07 | 10.23 | 10.53 | 10.69 | 10.99 | 11.15 | 11.45 |
| Camarilla | 10.71 | 10.76 | 10.80 | 10.84 | 10.88 | 10.92 | 10.97 |
| Woodie | 10.15 | 10.27 | 10.61 | 10.73 | 11.07 | 11.19 | 11.53 |
| Fibonacci | 10.23 | 10.40 | 10.51 | 10.69 | 10.86 | 10.97 | 11.15 |
| Pivot points | S3 | S2 | S1 | PP | R1 | R2 | R3 |
|---|---|---|---|---|---|---|---|
| Standard | 9.33 | 9.83 | 10.13 | 10.63 | 10.93 | 11.43 | 11.73 |
| Camarilla | 10.22 | 10.29 | 10.37 | 10.44 | 10.51 | 10.59 | 10.66 |
| Woodie | 9.24 | 9.78 | 10.04 | 10.58 | 10.84 | 11.38 | 11.64 |
| Fibonacci | 9.83 | 10.13 | 10.32 | 10.63 | 10.93 | 11.12 | 11.43 |
Numerical data
The following are the details of the technical indicators and moving averages that were collected to generate this technical analysis:
| RSI (14): | 80.37 | |
| MACD (12,26,9): | 0.1500 | |
| Directional Movement: | 47.46 | |
| AROON (14): | 78.57 | |
| DEMA (21): | 10.98 | |
| Parabolic SAR (0,02-0,02-0,2): | 10.80 | |
| Elder Ray (13): | 0.34 | |
| Super Trend (3,10): | 10.91 | |
| Zig ZAG (10): | 11.28 | |
| VORTEX (21): | 1.3500 | |
| Stochastique (14,3,5): | 95.10 | |
| TEMA (21): | 11.09 | |
| Williams %R (14): | 0.00 | |
| Chande Momentum Oscillator (20): | 0.68 | |
| Repulse (5,40,3): | 3.6000 | |
| ROCnROLL: | 1 | |
| TRIX (15,9): | 0.1200 | |
| Courbe Coppock: | 7.34 |
| MA7: | 10.67 | |
| MA20: | 10.55 | |
| MA50: | 10.52 | |
| MA100: | 10.27 | |
| MAexp7: | 11.03 | |
| MAexp20: | 10.80 | |
| MAexp50: | 10.65 | |
| MAexp100: | 10.59 | |
| Price / MA7: | +6.09% | |
| Price / MA20: | +7.30% | |
| Price / MA50: | +7.60% | |
| Price / MA100: | +10.22% | |
| Price / MAexp7: | +2.63% | |
| Price / MAexp20: | +4.81% | |
| Price / MAexp50: | +6.29% | |
| Price / MAexp100: | +6.89% |
About author
Online


Add a comment
Comments
0 comments on the analysis NEINOR H. - 1H