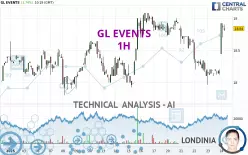
GL EVENTS - 1H - Technical analysis published on 01/24/2025 (GMT)
- 122
- 0
Click here for a new analysis!
- Timeframe : 1H
- - Analysis generated on
- Status : TARGET REACHED

Summary of the analysis

Additional analysis
Quotes
The GL EVENTS price is 18.84 EUR. The price has increased by +3.74% since the last closing and was traded between 18.44 EUR and 18.92 EUR over the period. The price is currently at +2.17% from its lowest and -0.42% from its highest.The Central Gaps scanner detects a bullish gap which is a sign that buyers have taken the lead in the very short term.
Opening Gap UP
Type : Bullish
Timeframe : Openning
Here is a more detailed summary of the historical variations registered by GL EVENTS:
Near a new LOW record (1st january)
Type : Bearish
Timeframe : Weekly
Near a new HIGH record (1 month)
Type : Bullish
Timeframe : Weekly
Technical
A technical analysis in 1H of this GL EVENTS chart shows a bullish trend. The signals returned by the moving averages are 71.43% bullish. This bullish trend is reinforced by the strong signals currently being given by short-term moving averages. There is no crossing of moving average by the price or crossing of moving averages between themselves.
In fact, 16 technical indicators on 18 studied are currently positioned bullish. Caution: the Central Indicators scanner currently detects an excess:
CCI indicator is overbought : over 100
Type : Neutral
Timeframe : 1 hour
Previous candle closed over Bollinger bands
Type : Neutral
Timeframe : 1 hour
Williams %R indicator is overbought : over -20
Type : Neutral
Timeframe : 1 hour
Pivot points : price is over resistance 3
Type : Neutral
Timeframe : 1 hour
MACD indicator is back over 0
Type : Bullish
Timeframe : 1 hour
An analysis of the price chart with the Central Patterns scanner (detector of chart patterns and resistances and supports) shows a result that can have an impact on the price change:
Near support of channel
Type : Bullish
Timeframe : 1 hour
The Central Candlesticks scanner currently notes the presence of this pattern in Japanese candlesticks that could mark the end of the short-term trend currently underway:
Doji
Type : Neutral
Timeframe : 1 hour
| S3 | S2 | S1 | Price | R1 | R2 | R3 | |
|---|---|---|---|---|---|---|---|
| ProTrendLines | 17.99 | 18.57 | 18.81 | 18.84 | 19.01 | 19.56 | 20.11 |
| Change (%) | -4.51% | -1.43% | -0.16% | - | +0.90% | +3.82% | +6.74% |
| Change | -0.85 | -0.27 | -0.03 | - | +0.17 | +0.72 | +1.27 |
| Level | Major | Major | Minor | - | Intermediate | Intermediate | Major |
To determine price objectives, it is also possible to use the pivot points. Here is the price position in relation to pivot points:
| Pivot points | S3 | S2 | S1 | PP | R1 | R2 | R3 |
|---|---|---|---|---|---|---|---|
| Standard | 17.77 | 17.87 | 18.01 | 18.11 | 18.25 | 18.35 | 18.49 |
| Camarilla | 18.09 | 18.12 | 18.14 | 18.16 | 18.18 | 18.20 | 18.23 |
| Woodie | 17.80 | 17.88 | 18.04 | 18.12 | 18.28 | 18.36 | 18.52 |
| Fibonacci | 17.87 | 17.96 | 18.02 | 18.11 | 18.20 | 18.26 | 18.35 |
| Pivot points | S3 | S2 | S1 | PP | R1 | R2 | R3 |
|---|---|---|---|---|---|---|---|
| Standard | 16.95 | 17.43 | 18.11 | 18.59 | 19.27 | 19.75 | 20.43 |
| Camarilla | 18.46 | 18.57 | 18.67 | 18.78 | 18.89 | 18.99 | 19.10 |
| Woodie | 17.04 | 17.48 | 18.20 | 18.64 | 19.36 | 19.80 | 20.52 |
| Fibonacci | 17.43 | 17.88 | 18.15 | 18.59 | 19.04 | 19.31 | 19.75 |
| Pivot points | S3 | S2 | S1 | PP | R1 | R2 | R3 |
|---|---|---|---|---|---|---|---|
| Standard | 12.36 | 13.72 | 16.06 | 17.42 | 19.76 | 21.12 | 23.46 |
| Camarilla | 17.38 | 17.72 | 18.06 | 18.40 | 18.74 | 19.08 | 19.42 |
| Woodie | 12.85 | 13.97 | 16.55 | 17.67 | 20.25 | 21.37 | 23.95 |
| Fibonacci | 13.72 | 15.13 | 16.01 | 17.42 | 18.83 | 19.71 | 21.12 |
Numerical data
The following is the status of the technical indicators and moving averages at the time of publication of this technical analysis:
| RSI (14): | 65.22 | |
| MACD (12,26,9): | 0.0200 | |
| Directional Movement: | 15.75 | |
| AROON (14): | 64.28 | |
| DEMA (21): | 18.41 | |
| Parabolic SAR (0,02-0,02-0,2): | 18.05 | |
| Elder Ray (13): | 0.40 | |
| Super Trend (3,10): | 18.38 | |
| Zig ZAG (10): | 18.82 | |
| VORTEX (21): | 0.9400 | |
| Stochastique (14,3,5): | 95.14 | |
| TEMA (21): | 18.51 | |
| Williams %R (14): | -10.42 | |
| Chande Momentum Oscillator (20): | 0.72 | |
| Repulse (5,40,3): | 1.6300 | |
| ROCnROLL: | 1 | |
| TRIX (15,9): | -0.0700 | |
| Courbe Coppock: | 2.47 |
| MA7: | 18.60 | |
| MA20: | 18.39 | |
| MA50: | 17.54 | |
| MA100: | 18.15 | |
| MAexp7: | 18.56 | |
| MAexp20: | 18.43 | |
| MAexp50: | 18.48 | |
| MAexp100: | 18.46 | |
| Price / MA7: | +1.29% | |
| Price / MA20: | +2.45% | |
| Price / MA50: | +7.41% | |
| Price / MA100: | +3.80% | |
| Price / MAexp7: | +1.51% | |
| Price / MAexp20: | +2.22% | |
| Price / MAexp50: | +1.95% | |
| Price / MAexp100: | +2.06% |
About author
Online


Add a comment
Comments
0 comments on the analysis GL EVENTS - 1H