| Open: | - |
| Change: | 0 |
| Volume: | - |
| Low: | - |
| High: | - |
| High / Low range: | - |
| Type: | Stocks |
| Ticker: | GIVN |
| ISIN: | CH0010645932 |
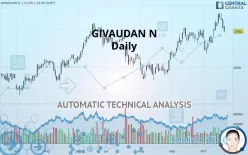
GIVAUDAN N - Daily - Technical analysis published on 10/22/2019 (GMT)
- 213
- 0
- 10/22/2019 - 09:06
- Who voted?
Click here for a new analysis!
- Timeframe : Daily
- - Analysis generated on 10/22/2019 - 09:05
- Status : TARGET REACHED

Summary of the analysis

Additional analysis
Quotes
The GIVAUDAN N price is 2,792.00 CHF. The price is lower by -0.64% since the last closing and was traded between 2,786.00 CHF and 2,821.00 CHF over the period. The price is currently at +0.22% from its lowest and -1.03% from its highest.A bearish gap was detected at the opening by the Central Gaps scanner. There are a lot of sellers and they have the upper hand in the very short term.
Opening Gap DOWN
Type : Bearish
Timeframe : Openning
A study of price movements over other periods shows the following variations:
New HIGH record (5 years)
Type : Bullish
Timeframe : Weekly
New HIGH record (1 year)
Type : Bullish
Timeframe : Weekly
New HIGH record (1st january)
Type : Bullish
Timeframe : Weekly
New HIGH record (1 month)
Type : Bullish
Timeframe : Weekly
Technical
A technical analysis in Daily of this GIVAUDAN N chart shows a strongly bullish trend. 92.86% of the signals given by moving averages are bullish. The overall trend is supported by the strong bullish signals from short-term moving averages. The Central Indicators scanner does not detect any result on moving averages that would impact this trend.
Technical indicators are strongly bullish, suggesting that the price increase should continue.
Caution: the Central Indicators scanner currently detects an excess:
CCI indicator is overbought : over 100
Type : Neutral
Timeframe : Daily
Previous candle closed over Bollinger bands
Type : Neutral
Timeframe : Daily
Williams %R indicator is overbought : over -20
Type : Neutral
Timeframe : Daily
Pivot points : price is over resistance 1
Type : Neutral
Timeframe : Weekly
Pivot points : price is under support 1
Type : Neutral
Timeframe : Daily
Ichimoku - Bullish crossover : Tenkan & Kijun
Type : Bullish
Timeframe : Daily
Price is back under the pivot point
Type : Bearish
Timeframe : Weekly
The Central Patterns scanner, which studies chart patterns, resistances and supports, has identified this signal:
Horizontal resistance is broken
Type : Bullish
Timeframe : Daily
The Central Candlesticks scanner, specialised in Japanese candlesticks, did not identify any signals.
| S3 | S2 | S1 | Price | R1 | R2 | |
|---|---|---|---|---|---|---|
| ProTrendLines | 2,537.00 | 2,693.00 | 2,788.00 | 2,792.00 | 2,831.00 | 2,885.00 |
| Change (%) | -9.13% | -3.55% | -0.14% | - | +1.40% | +3.33% |
| Change | -255.00 | -99.00 | -4.00 | - | +39.00 | +93.00 |
| Level | Major | Minor | Intermediate | - | Major | Minor |
To determine price objectives, it is also possible to use the pivot points. Here is the price position in relation to pivot points:
| Pivot points | S3 | S2 | S1 | PP | R1 | R2 | R3 |
|---|---|---|---|---|---|---|---|
| Standard | 2,827.67 | 2,844.33 | 2,855.67 | 2,872.33 | 2,883.67 | 2,900.33 | 2,911.67 |
| Camarilla | 2,859.30 | 2,861.87 | 2,864.43 | 2,867.00 | 2,869.57 | 2,872.13 | 2,874.70 |
| Woodie | 2,825.00 | 2,843.00 | 2,853.00 | 2,871.00 | 2,881.00 | 2,899.00 | 2,909.00 |
| Fibonacci | 2,844.33 | 2,855.03 | 2,861.64 | 2,872.33 | 2,883.03 | 2,889.64 | 2,900.33 |
| Pivot points | S3 | S2 | S1 | PP | R1 | R2 | R3 |
|---|---|---|---|---|---|---|---|
| Standard | 2,540.67 | 2,607.33 | 2,668.67 | 2,735.33 | 2,796.67 | 2,863.33 | 2,924.67 |
| Camarilla | 2,694.80 | 2,706.53 | 2,718.27 | 2,730.00 | 2,741.73 | 2,753.47 | 2,765.20 |
| Woodie | 2,538.00 | 2,606.00 | 2,666.00 | 2,734.00 | 2,794.00 | 2,862.00 | 2,922.00 |
| Fibonacci | 2,607.33 | 2,656.23 | 2,686.44 | 2,735.33 | 2,784.23 | 2,814.44 | 2,863.33 |
| Pivot points | S3 | S2 | S1 | PP | R1 | R2 | R3 |
|---|---|---|---|---|---|---|---|
| Standard | 2,524.00 | 2,588.00 | 2,686.00 | 2,750.00 | 2,848.00 | 2,912.00 | 3,010.00 |
| Camarilla | 2,739.45 | 2,754.30 | 2,769.15 | 2,784.00 | 2,798.85 | 2,813.70 | 2,828.55 |
| Woodie | 2,541.00 | 2,596.50 | 2,703.00 | 2,758.50 | 2,865.00 | 2,920.50 | 3,027.00 |
| Fibonacci | 2,588.00 | 2,649.88 | 2,688.12 | 2,750.00 | 2,811.88 | 2,850.12 | 2,912.00 |
Numerical data
The following is the status of the technical indicators and moving averages at the time of publication of this technical analysis:
| RSI (14): | 62.20 | |
| MACD (12,26,9): | 35.4300 | |
| Directional Movement: | 21.08 | |
| AROON (14): | 71.43 | |
| DEMA (21): | 2,831.10 | |
| Parabolic SAR (0,02-0,02-0,2): | 2,716.99 | |
| Elder Ray (13): | 64.43 | |
| Super Trend (3,10): | 2,752.57 | |
| Zig ZAG (10): | 2,853.00 | |
| VORTEX (21): | 1.0600 | |
| Stochastique (14,3,5): | 90.88 | |
| TEMA (21): | 2,845.07 | |
| Williams %R (14): | -17.13 | |
| Chande Momentum Oscillator (20): | 95.00 | |
| Repulse (5,40,3): | -0.4600 | |
| ROCnROLL: | 1 | |
| TRIX (15,9): | 0.1400 | |
| Courbe Coppock: | 4.78 |
| MA7: | 2,828.57 | |
| MA20: | 2,778.15 | |
| MA50: | 2,709.92 | |
| MA100: | 2,708.57 | |
| MAexp7: | 2,832.16 | |
| MAexp20: | 2,787.51 | |
| MAexp50: | 2,739.55 | |
| MAexp100: | 2,694.62 | |
| Price / MA7: | -1.29% | |
| Price / MA20: | +0.50% | |
| Price / MA50: | +3.03% | |
| Price / MA100: | +3.08% | |
| Price / MAexp7: | -1.42% | |
| Price / MAexp20: | +0.16% | |
| Price / MAexp50: | +1.91% | |
| Price / MAexp100: | +3.61% |
News
Don"t forget to follow the news on GIVAUDAN N. At the time of publication of this analysis, the latest news was as follows:
- 05/21/2018 - 12:00 Mixfit Expands Global Partnership With DSM And Givaudan In Personalized Nutrition
-
02/08/2017 - 03:58
 Givaudan
-
11/10/2016 - 01:11
Givaudan
About author

Online


Add a comment
Comments
0 comments on the analysis GIVAUDAN N - Daily