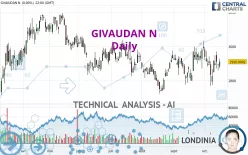
GIVAUDAN N - Daily - Technical analysis published on 10/17/2023 (GMT)
- 109
- 0
Click here for a new analysis!
- Timeframe : Daily
- - Analysis generated on
- Status : INVALID

Summary of the analysis

Additional analysis
Quotes
The GIVAUDAN N price is 2,883.0000 CHF. The price is lower by -0.93% since the last closing and was traded between 2,880.0000 CHF and 2,913.0000 CHF over the period. The price is currently at +0.10% from its lowest and -1.03% from its highest.The Central Gaps scanner detects a bearish opening. A small advantage for sellers in the very short term.
Bearish opening
Type : Bearish
Timeframe : Openning
So that you have an overall view of the price change, here is a table showing the variations over several periods:
Near a new HIGH record (1 month)
Type : Bullish
Timeframe : Weekly
Technical
Technical analysis of GIVAUDAN N in Daily shows an overall bearish trend. 64.29% of the signals given by moving averages are bearish. Caution: as the signals currently given by short-term moving averages are rather neutral, the bearish trend could slow down. An assessment of moving averages reveals several bearish signals that could impact this trend:
Bearish price crossover with Moving Average 100
Type : Bearish
Timeframe : Daily
Bearish price crossover with adaptative moving average 20
Type : Bearish
Timeframe : Daily
Bearish price crossover with adaptative moving average 100
Type : Bearish
Timeframe : Daily
An assessment of technical indicators shows a bearish signal.
But beware of excesses. The Central Indicators scanner currently detects this:
MACD indicator: bearish divergence
Type : Bearish
Timeframe : Daily
RSI indicator is back under 50
Type : Bearish
Timeframe : Daily
MACD indicator is back under 0
Type : Bearish
Timeframe : Daily
Williams %R indicator is back under -50
Type : Bearish
Timeframe : Daily
No signals are given by Central Patterns, a market scanner specialised in chart patterns, resistances and supports.
The Central Candlesticks scanner, specialised in Japanese candlesticks, did not identify any signals.
| S3 | S2 | S1 | Price | R1 | R2 | R3 | |
|---|---|---|---|---|---|---|---|
| ProTrendLines | 2,734.6646 | 2,815.0000 | 2,860.0000 | 2,883.0000 | 2,928.0000 | 3,007.0908 | 3,053.5454 |
| Change (%) | -5.15% | -2.36% | -0.80% | - | +1.56% | +4.30% | +5.92% |
| Change | -148.3354 | -68.0000 | -23.0000 | - | +45.0000 | +124.0908 | +170.5454 |
| Level | Major | Major | Major | - | Intermediate | Intermediate | Intermediate |
Attention could also be paid to pivot points to set price objectives:
| Pivot points | S3 | S2 | S1 | PP | R1 | R2 | R3 |
|---|---|---|---|---|---|---|---|
| Standard | 2,822.6667 | 2,847.3333 | 2,878.6667 | 2,903.3333 | 2,934.6667 | 2,959.3333 | 2,990.6667 |
| Camarilla | 2,894.6000 | 2,899.7333 | 2,904.8667 | 2,910.0000 | 2,915.1333 | 2,920.2667 | 2,925.4000 |
| Woodie | 2,826.0000 | 2,849.0000 | 2,882.0000 | 2,905.0000 | 2,938.0000 | 2,961.0000 | 2,994.0000 |
| Fibonacci | 2,847.3333 | 2,868.7253 | 2,881.9413 | 2,903.3333 | 2,924.7253 | 2,937.9413 | 2,959.3333 |
| Pivot points | S3 | S2 | S1 | PP | R1 | R2 | R3 |
|---|---|---|---|---|---|---|---|
| Standard | 2,593.6667 | 2,684.3333 | 2,789.6667 | 2,880.3333 | 2,985.6667 | 3,076.3333 | 3,181.6667 |
| Camarilla | 2,841.1000 | 2,859.0667 | 2,877.0333 | 2,895.0000 | 2,912.9667 | 2,930.9333 | 2,948.9000 |
| Woodie | 2,601.0000 | 2,688.0000 | 2,797.0000 | 2,884.0000 | 2,993.0000 | 3,080.0000 | 3,189.0000 |
| Fibonacci | 2,684.3333 | 2,759.2053 | 2,805.4613 | 2,880.3333 | 2,955.2053 | 3,001.4613 | 3,076.3333 |
| Pivot points | S3 | S2 | S1 | PP | R1 | R2 | R3 |
|---|---|---|---|---|---|---|---|
| Standard | 2,579.0000 | 2,678.0000 | 2,836.0000 | 2,935.0000 | 3,093.0000 | 3,192.0000 | 3,350.0000 |
| Camarilla | 2,923.3250 | 2,946.8833 | 2,970.4417 | 2,994.0000 | 3,017.5583 | 3,041.1167 | 3,064.6750 |
| Woodie | 2,608.5000 | 2,692.7500 | 2,865.5000 | 2,949.7500 | 3,122.5000 | 3,206.7500 | 3,379.5000 |
| Fibonacci | 2,678.0000 | 2,776.1740 | 2,836.8260 | 2,935.0000 | 3,033.1740 | 3,093.8260 | 3,192.0000 |
Numerical data
The following is the status of the technical indicators and moving averages at the time of publication of this technical analysis:
| RSI (14): | 47.88 | |
| MACD (12,26,9): | -1.0540 | |
| Directional Movement: | 0.3292 | |
| AROON (14): | -35.7143 | |
| DEMA (21): | 2,901.3298 | |
| Parabolic SAR (0,02-0,02-0,2): | 2,999.0533 | |
| Elder Ray (13): | -2.0076 | |
| Super Trend (3,10): | 2,808.9636 | |
| Zig ZAG (10): | 2,883.0000 | |
| VORTEX (21): | 1.0071 | |
| Stochastique (14,3,5): | 47.92 | |
| TEMA (21): | 2,895.6179 | |
| Williams %R (14): | -56.98 | |
| Chande Momentum Oscillator (20): | -111.0000 | |
| Repulse (5,40,3): | -0.4230 | |
| ROCnROLL: | 2 | |
| TRIX (15,9): | 0.0202 | |
| Courbe Coppock: | 3.45 |
| MA7: | 2,890.8571 | |
| MA20: | 2,919.7500 | |
| MA50: | 2,880.3200 | |
| MA100: | 2,908.1900 | |
| MAexp7: | 2,896.0168 | |
| MAexp20: | 2,900.3095 | |
| MAexp50: | 2,900.1921 | |
| MAexp100: | 2,916.3107 | |
| Price / MA7: | -0.27% | |
| Price / MA20: | -1.26% | |
| Price / MA50: | +0.09% | |
| Price / MA100: | -0.87% | |
| Price / MAexp7: | -0.45% | |
| Price / MAexp20: | -0.60% | |
| Price / MAexp50: | -0.59% | |
| Price / MAexp100: | -1.14% |
News
Don't forget to follow the news on GIVAUDAN N. At the time of publication of this analysis, the latest news was as follows:
- AMYRIS CLOSES STRATEGIC TRANSACTION WITH GIVAUDAN
- GIVAUDAN TO ACQUIRE PORTFOLIO OF MAJOR COSMETIC INGREDIENTS FROM AMYRIS AND TO ESTABLISH STRATEGIC PARTNERSHIP FOR NATURAL, SUSTAINABLY SOURCED INGREDIENTS FOR THE BEAUTY INDUSTRY
- Harris Williams Advises DDW The Color House on Its Sale to Givaudan
- Harris Williams Advises DDW The Color House on its Pending Sale to Givaudan
- Ginkgo Bioworks and Givaudan Enter Multi-Program Collaboration to Produce a Series of Ingredients
About author
Online


Add a comment
Comments
0 comments on the analysis GIVAUDAN N - Daily