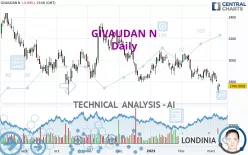
GIVAUDAN N - Daily - Technical analysis published on 03/09/2023 (GMT)
- 160
- 0
Click here for a new analysis!
- Timeframe : Daily
- - Analysis generated on
- Status : INVALID

Summary of the analysis

Additional analysis
Quotes
GIVAUDAN N rating 2,760.0000 CHF. The price registered a decrease of -0.04% on the session with the lowest point at 2,749.0000 CHF and the highest point at 2,778.0000 CHF. The deviation from the price is +0.40% for the low point and -0.65% for the high point.The Central Gaps scanner detects a bullish opening. A small advantage for buyers in the very short term.
Bullish opening
Type : Bullish
Timeframe : Openning
So that you have an overall view of the price change, here is a table showing the variations over several periods:
Near a new LOW record (1 year)
Type : Bearish
Timeframe : Weekly
Near a new LOW record (1st january)
Type : Bearish
Timeframe : Weekly
Near a new LOW record (1 month)
Type : Bearish
Timeframe : Weekly
Technical
Technical analysis of GIVAUDAN N in Daily shows a overall strongly bearish trend. The signals given by moving averages are 92.86% bearish. This strong bearish trend is confirmed by the strong signals currently being given by short-term moving averages. The Central Indicators market scanner currently does not detect any result that concerns moving averages.
In fact, 11 technical indicators on 18 studied are currently bearish. But beware of excesses. The Central Indicators scanner currently detects this:
CCI indicator is oversold : under -100
Type : Neutral
Timeframe : Daily
Previous candle closed under Bollinger bands
Type : Neutral
Timeframe : Daily
Pivot points : price is under support 1
Type : Neutral
Timeframe : Weekly
Central Patterns, the market scanner focusing on chart patterns, resistances and supports found these results:
Near horizontal support
Type : Bullish
Timeframe : Daily
Support of channel is broken
Type : Bearish
Timeframe : Daily
The Central Candlesticks scanner, specialised in Japanese candlesticks, did not identify any signals.
| S3 | S2 | S1 | Price | R1 | R2 | R3 | |
|---|---|---|---|---|---|---|---|
| ProTrendLines | 912.4710 | 1,355.2100 | 1,903.5500 | 2,760.0000 | 2,780.8900 | 2,839.3300 | 3,053.5000 |
| Change (%) | -66.94% | -50.90% | -31.03% | - | +0.76% | +2.87% | +10.63% |
| Change | -1,847.5290 | -1,404.7900 | -856.4500 | - | +20.8900 | +79.3300 | +293.5000 |
| Level | Minor | Minor | Minor | - | Major | Major | Intermediate |
Attention could also be paid to pivot points to set price objectives:
| Pivot points | S3 | S2 | S1 | PP | R1 | R2 | R3 |
|---|---|---|---|---|---|---|---|
| Standard | 2,617.6667 | 2,654.3333 | 2,707.6667 | 2,744.3333 | 2,797.6667 | 2,834.3333 | 2,887.6667 |
| Camarilla | 2,736.2500 | 2,744.5000 | 2,752.7500 | 2,761.0000 | 2,769.2500 | 2,777.5000 | 2,785.7500 |
| Woodie | 2,626.0000 | 2,658.5000 | 2,716.0000 | 2,748.5000 | 2,806.0000 | 2,838.5000 | 2,896.0000 |
| Fibonacci | 2,654.3333 | 2,688.7133 | 2,709.9533 | 2,744.3333 | 2,778.7133 | 2,799.9533 | 2,834.3333 |
| Pivot points | S3 | S2 | S1 | PP | R1 | R2 | R3 |
|---|---|---|---|---|---|---|---|
| Standard | 2,646.0000 | 2,713.0000 | 2,787.0000 | 2,854.0000 | 2,928.0000 | 2,995.0000 | 3,069.0000 |
| Camarilla | 2,822.2250 | 2,835.1500 | 2,848.0750 | 2,861.0000 | 2,873.9250 | 2,886.8500 | 2,899.7750 |
| Woodie | 2,649.5000 | 2,714.7500 | 2,790.5000 | 2,855.7500 | 2,931.5000 | 2,996.7500 | 3,072.5000 |
| Fibonacci | 2,713.0000 | 2,766.8620 | 2,800.1380 | 2,854.0000 | 2,907.8620 | 2,941.1380 | 2,995.0000 |
| Pivot points | S3 | S2 | S1 | PP | R1 | R2 | R3 |
|---|---|---|---|---|---|---|---|
| Standard | 2,493.3333 | 2,651.6667 | 2,746.3333 | 2,904.6667 | 2,999.3333 | 3,157.6667 | 3,252.3333 |
| Camarilla | 2,771.4250 | 2,794.6167 | 2,817.8083 | 2,841.0000 | 2,864.1917 | 2,887.3833 | 2,910.5750 |
| Woodie | 2,461.5000 | 2,635.7500 | 2,714.5000 | 2,888.7500 | 2,967.5000 | 3,141.7500 | 3,220.5000 |
| Fibonacci | 2,651.6667 | 2,748.3127 | 2,808.0207 | 2,904.6667 | 3,001.3127 | 3,061.0207 | 3,157.6667 |
Numerical data
The following is the status of technical indicators and moving averages registered at the time this technical analysis was created:
| RSI (14): | 34.73 | |
| MACD (12,26,9): | -41.3381 | |
| Directional Movement: | -19.6651 | |
| AROON (14): | -64.2857 | |
| DEMA (21): | 2,801.5318 | |
| Parabolic SAR (0,02-0,02-0,2): | 2,895.0176 | |
| Elder Ray (13): | -66.2764 | |
| Super Trend (3,10): | 2,941.1440 | |
| Zig ZAG (10): | 2,756.0000 | |
| VORTEX (21): | 0.7829 | |
| Stochastique (14,3,5): | 23.94 | |
| TEMA (21): | 2,781.7464 | |
| Williams %R (14): | -71.74 | |
| Chande Momentum Oscillator (20): | -95.0000 | |
| Repulse (5,40,3): | -0.6836 | |
| ROCnROLL: | 2 | |
| TRIX (15,9): | -0.1613 | |
| Courbe Coppock: | 4.99 |
| MA7: | 2,811.7143 | |
| MA20: | 2,849.8000 | |
| MA50: | 2,922.4000 | |
| MA100: | 2,981.6600 | |
| MAexp7: | 2,802.8098 | |
| MAexp20: | 2,852.2915 | |
| MAexp50: | 2,908.7136 | |
| MAexp100: | 2,977.8822 | |
| Price / MA7: | -1.84% | |
| Price / MA20: | -3.15% | |
| Price / MA50: | -5.56% | |
| Price / MA100: | -7.43% | |
| Price / MAexp7: | -1.53% | |
| Price / MAexp20: | -3.24% | |
| Price / MAexp50: | -5.11% | |
| Price / MAexp100: | -7.32% |
News
Don't forget to follow the news on GIVAUDAN N. At the time of publication of this analysis, the latest news was as follows:
- GIVAUDAN TO ACQUIRE PORTFOLIO OF MAJOR COSMETIC INGREDIENTS FROM AMYRIS AND TO ESTABLISH STRATEGIC PARTNERSHIP FOR NATURAL, SUSTAINABLY SOURCED INGREDIENTS FOR THE BEAUTY INDUSTRY
- Harris Williams Advises DDW The Color House on Its Sale to Givaudan
- Harris Williams Advises DDW The Color House on its Pending Sale to Givaudan
- Ginkgo Bioworks and Givaudan Enter Multi-Program Collaboration to Produce a Series of Ingredients
- Givaudan Launches Groundbreaking Consumer Segmentation Tool In North America Focused On Flavor
About author
Online


Add a comment
Comments
0 comments on the analysis GIVAUDAN N - Daily