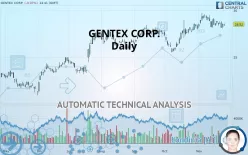
GENTEX CORP. - Daily - Technical analysis published on 11/26/2019 (GMT)
- 274
- 0
- Who voted?
Click here for a new analysis!
- Timeframe : Daily
- - Analysis generated on
- Status : INVALID

Summary of the analysis

Additional analysis
Quotes
GENTEX CORP. rating 28.52 USD. The price registered a decrease of -0.07% on the session and was between 28.30 USD and 28.56 USD. This implies that the price is at +0.78% from its lowest and at -0.14% from its highest.The Central Gaps scanner detects a bearish opening. A small advantage for sellers in the very short term.
Bearish opening
Type : Bearish
Timeframe : Openning
A study of price movements over other periods shows the following variations:
Near a new HIGH record (5 years)
Type : Bullish
Timeframe : Weekly
Near a new HIGH record (1 year)
Type : Bullish
Timeframe : Weekly
Near a new HIGH record (1st january)
Type : Bullish
Timeframe : Weekly
Technical
Technical analysis of GENTEX CORP. in Daily shows a strongly overall bullish trend. The signals given by moving averages are 85.71% bullish. This strongly bullish trend seems to be running out of steam given the signals being given by short-term moving averages. An assessment of moving averages reveals a bearish signal that could impact this trend:
Bearish price crossover with adaptative moving average 20
Type : Bearish
Timeframe : Daily
On the 18 technical indicators analysed, 4 are bullish, 8 are neutral and 6 are bearish. Caution: the Central Indicators scanner currently detects an excess:
Williams %R indicator is oversold : under -80
Type : Neutral
Timeframe : Daily
RSI indicator is back over 50
Type : Bullish
Timeframe : Daily
Price is back under the pivot point
Type : Bearish
Timeframe : Daily
Price is back under the pivot point
Type : Bearish
Timeframe : Weekly
The Central Patterns scanner, which studies chart patterns, resistances and supports, has identified this signal:
Support of channel is broken
Type : Bearish
Timeframe : Daily
The presence of a bullish Japanese candlestick pattern detected by Central Candlesticks that could cause a very short term rebound was also detected:
Bullish harami
Type : Bullish
Timeframe : Daily
| S3 | S2 | S1 | Price | R1 | |
|---|---|---|---|---|---|
| ProTrendLines | 23.49 | 25.22 | 28.06 | 28.52 | 29.39 |
| Change (%) | -17.64% | -11.57% | -1.61% | - | +3.05% |
| Change | -5.03 | -3.30 | -0.46 | - | +0.87 |
| Level | Intermediate | Major | Major | - | Intermediate |
To determine price objectives, it is also possible to use the pivot points. Here is the price position in relation to pivot points:
| Pivot points | S3 | S2 | S1 | PP | R1 | R2 | R3 |
|---|---|---|---|---|---|---|---|
| Standard | 27.19 | 27.65 | 27.90 | 28.36 | 28.60 | 29.06 | 29.31 |
| Camarilla | 27.95 | 28.01 | 28.08 | 28.14 | 28.21 | 28.27 | 28.33 |
| Woodie | 27.08 | 27.60 | 27.79 | 28.30 | 28.49 | 29.01 | 29.20 |
| Fibonacci | 27.65 | 27.92 | 28.09 | 28.36 | 28.63 | 28.79 | 29.06 |
| Pivot points | S3 | S2 | S1 | PP | R1 | R2 | R3 |
|---|---|---|---|---|---|---|---|
| Standard | 22.65 | 24.08 | 26.06 | 27.49 | 29.47 | 30.90 | 32.89 |
| Camarilla | 27.11 | 27.43 | 27.74 | 28.05 | 28.36 | 28.68 | 28.99 |
| Woodie | 22.93 | 24.22 | 26.35 | 27.63 | 29.76 | 31.04 | 33.17 |
| Fibonacci | 24.08 | 25.38 | 26.18 | 27.49 | 28.79 | 29.60 | 30.90 |
Numerical data
The following is the status of the technical indicators and moving averages at the time of publication of this technical analysis:
| RSI (14): | 52.48 | |
| MACD (12,26,9): | 0.1900 | |
| Directional Movement: | 4.04 | |
| AROON (14): | -100.00 | |
| DEMA (21): | 28.79 | |
| Parabolic SAR (0,02-0,02-0,2): | 29.26 | |
| Elder Ray (13): | -0.25 | |
| Super Trend (3,10): | 27.78 | |
| Zig ZAG (10): | 28.54 | |
| VORTEX (21): | 1.0000 | |
| Stochastique (14,3,5): | 21.26 | |
| TEMA (21): | 28.68 | |
| Williams %R (14): | -67.55 | |
| Chande Momentum Oscillator (20): | -0.86 | |
| Repulse (5,40,3): | -0.4100 | |
| ROCnROLL: | -1 | |
| TRIX (15,9): | 0.1700 | |
| Courbe Coppock: | 1.64 |
| MA7: | 28.49 | |
| MA20: | 28.71 | |
| MA50: | 27.82 | |
| MA100: | 27.08 | |
| MAexp7: | 28.49 | |
| MAexp20: | 28.47 | |
| MAexp50: | 27.91 | |
| MAexp100: | 26.93 | |
| Price / MA7: | +0.11% | |
| Price / MA20: | -0.66% | |
| Price / MA50: | +2.52% | |
| Price / MA100: | +5.32% | |
| Price / MAexp7: | +0.11% | |
| Price / MAexp20: | +0.18% | |
| Price / MAexp50: | +2.19% | |
| Price / MAexp100: | +5.90% |
News
The last news published on GENTEX CORP. at the time of the generation of this analysis was as follows:
- Gentex to Launch Three New Aftermarket Products and Demonstrate Technology Concepts at SEMA 2019
- Gentex Reports Third Quarter 2019 Financial Results
- Gentex Reports Third Quarter 2019 Earnings Release Date and Conference Call
- Gentex to Offer Its New Car-to-Home Automation System Through VOXX Electronics
- Gentex Reports Second Quarter 2019 Financial Results
About author

Online


Add a comment
Comments
0 comments on the analysis GENTEX CORP. - Daily