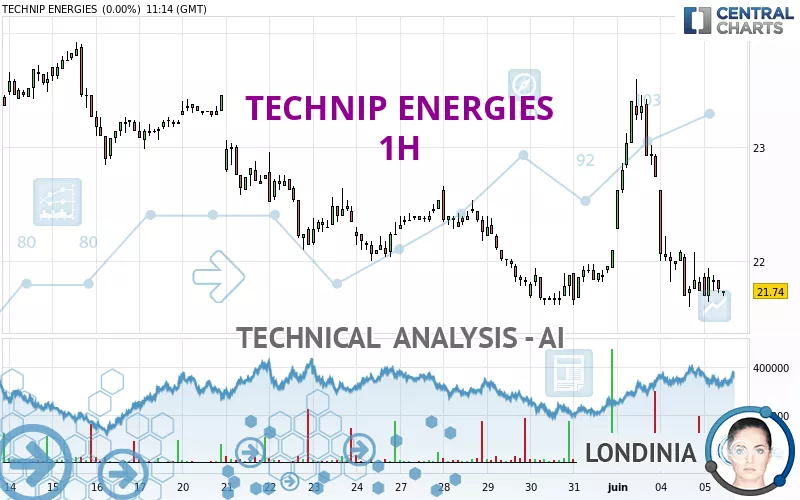
TECHNIP ENERGIES - 1H - Technical analysis published on 06/05/2024 (GMT)
- 165
- 0
Click here for a new analysis!
- Timeframe : 1H
- - Analysis generated on
- Status : LEVEL MAINTAINED

Summary of the analysis

Additional analysis
Quotes
TECHNIP ENERGIES rating 21.72 EUR. On the day, this instrument lost -0.09% with the lowest point at 21.64 EUR and the highest point at 21.94 EUR. The deviation from the price is +0.37% for the low point and -1.00% for the high point.A bullish opening was detected by the Central Gaps scanner. Buyers are trying to impose a bullish momentum in the very short term.
Bullish opening
Type : Bullish
Timeframe : Openning
Here is a more detailed summary of the historical variations registered by TECHNIP ENERGIES:
Near a new HIGH record (5 years)
Type : Bullish
Timeframe : Weekly
Near a new LOW record (1 month)
Type : Bearish
Timeframe : Weekly
Technical
Technical analysis of this 1H chart of TECHNIP ENERGIES indicates that the overall trend is strongly bearish. 85.71% of the signals given by moving averages are bearish. This strongly bearish trend is supported by the strong bearish signals given by short-term moving averages. The Central Indicators scanner does not detect any result on moving averages that would impact this trend.
An assessment of technical indicators shows a bearish signal.
But beware of excesses. The Central Indicators scanner currently detects this:
Williams %R indicator is oversold : under -80
Type : Neutral
Timeframe : 1 hour
Price is back under the pivot point
Type : Bearish
Timeframe : Weekly
No signals are given by Central Patterns, a market scanner specialised in chart patterns, resistances and supports.
Central Candlesticks, the scanner specialised in Japanese candlesticks, detects a bullish signal that could support the hypothesis of a small rebound in the very short term:
Bullish doji star
Type : Bullish
Timeframe : 1 hour
| S3 | S2 | S1 | Price | R1 | R2 | R3 | |
|---|---|---|---|---|---|---|---|
| ProTrendLines | 19.76 | 21.47 | 21.62 | 21.72 | 22.29 | 22.51 | 22.66 |
| Change (%) | -9.02% | -1.15% | -0.46% | - | +2.62% | +3.64% | +4.33% |
| Change | -1.96 | -0.25 | -0.10 | - | +0.57 | +0.79 | +0.94 |
| Level | Intermediate | Major | Intermediate | - | Minor | Minor | Intermediate |
Attention could also be paid to pivot points to set price objectives:
| Pivot points | S3 | S2 | S1 | PP | R1 | R2 | R3 |
|---|---|---|---|---|---|---|---|
| Standard | 20.33 | 20.97 | 21.35 | 21.99 | 22.37 | 23.01 | 23.39 |
| Camarilla | 21.46 | 21.55 | 21.65 | 21.74 | 21.83 | 21.93 | 22.02 |
| Woodie | 20.21 | 20.91 | 21.23 | 21.93 | 22.25 | 22.95 | 23.27 |
| Fibonacci | 20.97 | 21.36 | 21.60 | 21.99 | 22.38 | 22.62 | 23.01 |
| Pivot points | S3 | S2 | S1 | PP | R1 | R2 | R3 |
|---|---|---|---|---|---|---|---|
| Standard | 20.55 | 21.09 | 21.59 | 22.13 | 22.63 | 23.17 | 23.67 |
| Camarilla | 21.81 | 21.91 | 22.01 | 22.10 | 22.20 | 22.29 | 22.39 |
| Woodie | 20.54 | 21.08 | 21.58 | 22.12 | 22.62 | 23.16 | 23.66 |
| Fibonacci | 21.09 | 21.48 | 21.73 | 22.13 | 22.52 | 22.77 | 23.17 |
| Pivot points | S3 | S2 | S1 | PP | R1 | R2 | R3 |
|---|---|---|---|---|---|---|---|
| Standard | 17.43 | 18.87 | 20.48 | 21.92 | 23.53 | 24.97 | 26.58 |
| Camarilla | 21.26 | 21.54 | 21.82 | 22.10 | 22.38 | 22.66 | 22.94 |
| Woodie | 17.53 | 18.91 | 20.58 | 21.96 | 23.63 | 25.01 | 26.68 |
| Fibonacci | 18.87 | 20.03 | 20.75 | 21.92 | 23.08 | 23.80 | 24.97 |
Numerical data
The following is the status of technical indicators and moving averages registered at the time this technical analysis was created:
| RSI (14): | 40.45 | |
| MACD (12,26,9): | -0.1500 | |
| Directional Movement: | -6.92 | |
| AROON (14): | -57.14 | |
| DEMA (21): | 21.89 | |
| Parabolic SAR (0,02-0,02-0,2): | 22.38 | |
| Elder Ray (13): | -0.16 | |
| Super Trend (3,10): | 22.34 | |
| Zig ZAG (10): | 21.72 | |
| VORTEX (21): | 0.8400 | |
| Stochastique (14,3,5): | 12.88 | |
| TEMA (21): | 21.69 | |
| Williams %R (14): | -90.20 | |
| Chande Momentum Oscillator (20): | -0.34 | |
| Repulse (5,40,3): | -0.3700 | |
| ROCnROLL: | 2 | |
| TRIX (15,9): | -0.0600 | |
| Courbe Coppock: | 8.60 |
| MA7: | 22.04 | |
| MA20: | 22.43 | |
| MA50: | 22.44 | |
| MA100: | 21.18 | |
| MAexp7: | 21.80 | |
| MAexp20: | 22.04 | |
| MAexp50: | 22.15 | |
| MAexp100: | 22.23 | |
| Price / MA7: | -1.45% | |
| Price / MA20: | -3.17% | |
| Price / MA50: | -3.21% | |
| Price / MA100: | +2.55% | |
| Price / MAexp7: | -0.37% | |
| Price / MAexp20: | -1.45% | |
| Price / MAexp50: | -1.94% | |
| Price / MAexp100: | -2.29% |
News
The latest news and videos published on TECHNIP ENERGIES at the time of the analysis were as follows:
- Weekly report share buyback from May 27 to May 31, 2024
- Voting results of the 2024 Annual General Meeting of Technip Energies
- Technip Energies Loading Systems launches the eMAX series, a new era for loading arms, and signs a strategic partnership agreement with Cascade Drives AB
- Technip Energies Awarded a Substantial Contract for TotalEnergies and OQ’s Marsa LNG Project in Oman
- Technip Energies Announces Publication Date for First Quarter of 2024 Financial Results and Conference Call
About author
Online


Add a comment
Comments
0 comments on the analysis TECHNIP ENERGIES - 1H