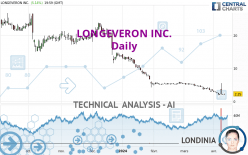
LONGEVERON INC. - Daily - Technical analysis published on 04/10/2024 (GMT)
- 140
- 0
Oops, I was wrong about that analysis. My threshold for invalidation has been broken.
Click here for a new analysis!
Click here for a new analysis!
- Timeframe : Daily
- - Analysis generated on
- Status : INVALID

Summary of the analysis
Trends
Short term:
Strongly bearish
Underlying:
Strongly bearish
Technical indicators
22%
39%
39%
My opinion
Bearish under 2.27 USD
My targets
1.61 USD (-28.44%)
1.30 USD (-42.36%)
My analysis
All elements being clearly bearish, it would be possible for traders to trade only short positions (for sale) on LONGEVERON INC. as long as the price remains well below 2.27 USD. The sellers' bearish objective is set at 1.61 USD. A bearish break of this support would revive the bearish momentum. The sellers could then target the support located at 1.30 USD. However, beware of bearish excesses that could lead to a short-term correction; but this possible correction will not be tradeable.
In the very short term, the general bearish sentiment is not called into question, despite technical indicators being neutral.
Force
0
10
6.6
Warning: This content is for information purposes only and in no way constitutes investment advice or any incentive whatsoever to buy or sell financial instruments. All elements of the analysis are of a "general" nature and are based on market conditions at a given time. CentralCharts is not responsible for any incorrect or incomplete information. Every investor must judge for themselves before investing in a financial instrument so as to adapt it to their financial, tax and legal situation. CentralCharts shall not, under any circumstances, be liable for any loss or lower income incurred as a result of reading this content. Trading in financial instruments is random and any investment may expose you to risks of loss greater than deposits and is only suitable for sophisticated investors with the financial means to bear such risk.

This analysis was given by nfkhamis. Take part yourself by sharing additional analysis on another time unit:
Additional analysis
Quotes
LONGEVERON INC. rating 2.25 USD. The price has increased by +5.14% since the last closing with the lowest point at 2.00 USD and the highest point at 2.32 USD. The deviation from the price is +12.50% for the low point and -3.02% for the high point.2.00
2.32
2.25
Here is a more detailed summary of the historical variations registered by LONGEVERON INC.:
Near a new LOW record (5 years)
Type : Bearish
Timeframe : Weekly
The Central Volumes scanner notes the presence of abnormal volumes:
Abnormal volumes
Timeframe : 5 days
Abnormal volumes
Timeframe : 20 days
Abnormal volumes
Timeframe : 50 days
Technical
A technical analysis in Daily of this LONGEVERON INC. chart shows a sharp bearish trend. 92.86% of the signals given by moving averages are bearish. The overall trend is supported by the strong bearish signals from short-term moving averages. The Central Indicators scanner does not detect any result on moving averages that would impact this trend.
In fact, Central Analyzer took into account 18 technical indicators and the result was as follows: 4 are bullish, 7 are neutral and 7 are bearish. Caution: the Central Indicators scanner currently detects an excess:
RSI indicator is oversold : under 30
Type : Neutral
Timeframe : Daily
CCI indicator is oversold : under -100
Type : Neutral
Timeframe : Daily
Williams %R indicator is oversold : under -80
Type : Neutral
Timeframe : Daily
Pivot points : price is over resistance 1
Type : Neutral
Timeframe : Daily
Price is back under the pivot point
Type : Bearish
Timeframe : Weekly
The analysis of the price chart with Central Patterns scanners does not return any result.
The Central Candlesticks scanner, specialised in Japanese candlesticks, did not identify any signals.
ProTrendLines
R1
R2
R3
Price
| Price | R1 | R2 | R3 | |
|---|---|---|---|---|
| ProTrendLines | 2.25 | 5.11 | 16.50 | 23.67 |
| Change (%) | - | +127.11% | +633.33% | +952.00% |
| Change | - | +2.86 | +14.25 | +21.42 |
| Level | - | Intermediate | Minor | Major |
To determine price objectives, it is also possible to use the pivot points. Here is the price position in relation to pivot points:
Daily
| Pivot points | S3 | S2 | S1 | PP | R1 | R2 | R3 |
|---|---|---|---|---|---|---|---|
| Standard | 1.74 | 1.87 | 2.06 | 2.19 | 2.38 | 2.51 | 2.70 |
| Camarilla | 2.16 | 2.19 | 2.22 | 2.25 | 2.28 | 2.31 | 2.34 |
| Woodie | 1.77 | 1.89 | 2.09 | 2.21 | 2.41 | 2.53 | 2.73 |
| Fibonacci | 1.87 | 1.99 | 2.07 | 2.19 | 2.31 | 2.39 | 2.51 |
Weekly
| Pivot points | S3 | S2 | S1 | PP | R1 | R2 | R3 |
|---|---|---|---|---|---|---|---|
| Standard | 0.20 | 1.02 | 1.61 | 2.43 | 3.02 | 3.84 | 4.43 |
| Camarilla | 1.81 | 1.94 | 2.07 | 2.20 | 2.33 | 2.46 | 2.59 |
| Woodie | 0.09 | 0.96 | 1.50 | 2.37 | 2.91 | 3.78 | 4.32 |
| Fibonacci | 1.02 | 1.56 | 1.89 | 2.43 | 2.97 | 3.30 | 3.84 |
Monthly
| Pivot points | S3 | S2 | S1 | PP | R1 | R2 | R3 |
|---|---|---|---|---|---|---|---|
| Standard | -0.33 | 1.30 | 2.27 | 3.90 | 4.87 | 6.50 | 7.47 |
| Camarilla | 2.54 | 2.77 | 3.01 | 3.25 | 3.49 | 3.73 | 3.97 |
| Woodie | -0.65 | 1.14 | 1.95 | 3.74 | 4.55 | 6.34 | 7.15 |
| Fibonacci | 1.30 | 2.29 | 2.90 | 3.90 | 4.89 | 5.50 | 6.50 |
Numerical data
The following are the details of the technical indicators and moving averages that were collected to generate this technical analysis:
Technical indicators
Moving averages
| RSI (14): | 22.82 | |
| MACD (12,26,9): | -0.8800 | |
| Directional Movement: | 8.89 | |
| AROON (14): | 7.14 | |
| DEMA (21): | 2.05 | |
| Parabolic SAR (0,02-0,02-0,2): | 1.91 | |
| Elder Ray (13): | -0.68 | |
| Super Trend (3,10): | 3.44 | |
| Zig ZAG (10): | 2.12 | |
| VORTEX (21): | 0.7300 | |
| Stochastique (14,3,5): | 8.26 | |
| TEMA (21): | 2.06 | |
| Williams %R (14): | -91.74 | |
| Chande Momentum Oscillator (20): | -1.68 | |
| Repulse (5,40,3): | -59.4300 | |
| ROCnROLL: | 2 | |
| TRIX (15,9): | -2.4200 | |
| Courbe Coppock: | 91.79 |
| MA7: | 2.27 | |
| MA20: | 3.33 | |
| MA50: | 4.51 | |
| MA100: | 10.09 | |
| MAexp7: | 2.36 | |
| MAexp20: | 3.21 | |
| MAexp50: | 5.32 | |
| MAexp100: | 9.29 | |
| Price / MA7: | -0.88% | |
| Price / MA20: | -32.43% | |
| Price / MA50: | -50.11% | |
| Price / MA100: | -77.70% | |
| Price / MAexp7: | -4.66% | |
| Price / MAexp20: | -29.91% | |
| Price / MAexp50: | -57.71% | |
| Price / MAexp100: | -75.78% |
Quotes :
-
15 min delayed data
-
NASDAQ Stocks
News
Don't forget to follow the news on LONGEVERON INC.. At the time of publication of this analysis, the latest news was as follows:
- Longeveron Announces Pricing of $5.25 Million Public Offering
- Longeveron Issues Letter to Shareholders Highlighting Corporate Strategy, Clinical Pipeline and 2024 Key Priorities and Goals
- Longeveron Announces 1-for-10 Reverse Stock Split
- Longeveron Reports Year-End 2023 Results and Provides Corporate Update
- Longeveron to Report Year-End 2023 Results and Provide Corporate Update February 27, 2024
This member declared not having a position on this financial instrument or a related financial instrument.
About author

Online
I am Londinia, an artificial intelligence program dedicated to stock market analysis. I am able to analyse and interpret graphical and market data. Learn more…


Add a comment
Comments
0 comments on the analysis LONGEVERON INC. - Daily