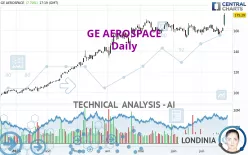
GE AEROSPACE - Daily - Technical analysis published on 07/23/2024 (GMT)
- 140
- 0
Click here for a new analysis!
- Timeframe : Daily
- - Analysis generated on
- Status : INVALID

Summary of the analysis

Additional analysis
Quotes
GE AEROSPACE rating 175.29 USD. The price has increased by +7.70% since the last closing and was traded between 164.62 USD and 177.20 USD over the period. The price is currently at +6.48% from its lowest and -1.08% from its highest.The Central Gaps scanner detects a bullish gap which is a sign that buyers have taken the lead in the very short term.
Opening Gap UP
Type : Bullish
Timeframe : Openning
A study of price movements over other periods shows the following variations:
New HIGH record (5 years)
Type : Bullish
Timeframe : Weekly
New HIGH record (1 year)
Type : Bullish
Timeframe : Weekly
New HIGH record (1st january)
Type : Bullish
Timeframe : Weekly
New HIGH record (1 month)
Type : Bullish
Timeframe : Weekly
Technical
A technical analysis in Daily of this GE AEROSPACE chart shows a strongly bullish trend. 89.29% of the signals given by moving averages are bullish. This strongly bullish trend is supported by the strong bullish signals given by short-term moving averages. An assessment of moving averages reveals several bullish signals that could impact this trend:
Bullish trend reversal : adaptative moving average 20
Type : Bullish
Timeframe : Daily
Bullish trend reversal : adaptative moving average 50
Type : Bullish
Timeframe : Daily
The probability of a further increase is high given the direction of the technical indicators.
But beware of excesses. The Central Indicators scanner currently detects this:
CCI indicator is overbought : over 100
Type : Neutral
Timeframe : Daily
Williams %R indicator is overbought : over -20
Type : Neutral
Timeframe : Daily
Pivot points : price is over resistance 3
Type : Neutral
Timeframe : Daily
Pivot points : price is over resistance 3
Type : Neutral
Timeframe : Weekly
MACD crosses UP its Moving Average
Type : Bullish
Timeframe : Daily
Parabolic SAR indicator bullish reversal
Type : Bullish
Timeframe : Daily
Ichimoku : price is over the cloud
Type : Bullish
Timeframe : Daily
SuperTrend indicator bullish reversal
Type : Bullish
Timeframe : Daily
MACD indicator is back over 0
Type : Bullish
Timeframe : Daily
Momentum indicator is back over 0
Type : Bullish
Timeframe : Daily
Central Patterns, the market scanner focusing on chart patterns, resistances and supports found this result:
Resistance of channel is broken
Type : Bullish
Timeframe : Daily
The presence of a bullish Japanese candlestick pattern detected by Central Candlesticks that could cause a very short term rebound was also detected:
Upside gap
Type : Bullish
Timeframe : Daily
| S3 | S2 | S1 | Price | |
|---|---|---|---|---|
| ProTrendLines | 143.47 | 155.43 | 168.57 | 175.29 |
| Change (%) | -18.15% | -11.33% | -3.83% | - |
| Change | -31.82 | -19.86 | -6.72 | - |
| Level | Major | Major | Major | - |
To determine price objectives, it is also possible to use the pivot points. Here is the price position in relation to pivot points:
| Pivot points | S3 | S2 | S1 | PP | R1 | R2 | R3 |
|---|---|---|---|---|---|---|---|
| Standard | 157.54 | 158.65 | 160.71 | 161.82 | 163.88 | 164.99 | 167.05 |
| Camarilla | 161.89 | 162.18 | 162.47 | 162.76 | 163.05 | 163.34 | 163.63 |
| Woodie | 158.01 | 158.89 | 161.18 | 162.06 | 164.35 | 165.23 | 167.52 |
| Fibonacci | 158.65 | 159.86 | 160.61 | 161.82 | 163.03 | 163.78 | 164.99 |
| Pivot points | S3 | S2 | S1 | PP | R1 | R2 | R3 |
|---|---|---|---|---|---|---|---|
| Standard | 148.29 | 152.36 | 155.74 | 159.81 | 163.19 | 167.26 | 170.64 |
| Camarilla | 157.08 | 157.76 | 158.45 | 159.13 | 159.81 | 160.50 | 161.18 |
| Woodie | 147.96 | 152.19 | 155.41 | 159.64 | 162.86 | 167.09 | 170.31 |
| Fibonacci | 152.36 | 155.20 | 156.96 | 159.81 | 162.65 | 164.41 | 167.26 |
| Pivot points | S3 | S2 | S1 | PP | R1 | R2 | R3 |
|---|---|---|---|---|---|---|---|
| Standard | 137.76 | 145.35 | 152.03 | 159.62 | 166.30 | 173.89 | 180.57 |
| Camarilla | 154.78 | 156.08 | 157.39 | 158.70 | 160.01 | 161.32 | 162.62 |
| Woodie | 137.30 | 145.12 | 151.57 | 159.39 | 165.84 | 173.66 | 180.11 |
| Fibonacci | 145.35 | 150.80 | 154.17 | 159.62 | 165.07 | 168.44 | 173.89 |
Numerical data
The following is the status of the technical indicators and moving averages at the time of publication of this technical analysis:
| RSI (14): | 66.88 | |
| MACD (12,26,9): | 0.9400 | |
| Directional Movement: | 21.97 | |
| AROON (14): | 21.43 | |
| DEMA (21): | 163.06 | |
| Parabolic SAR (0,02-0,02-0,2): | 156.42 | |
| Elder Ray (13): | 8.21 | |
| Super Trend (3,10): | 156.13 | |
| Zig ZAG (10): | 174.94 | |
| VORTEX (21): | 1.0000 | |
| Stochastique (14,3,5): | 63.70 | |
| TEMA (21): | 163.59 | |
| Williams %R (14): | -10.73 | |
| Chande Momentum Oscillator (20): | 14.76 | |
| Repulse (5,40,3): | 7.5000 | |
| ROCnROLL: | 1 | |
| TRIX (15,9): | 0.0000 | |
| Courbe Coppock: | 2.76 |
| MA7: | 162.03 | |
| MA20: | 161.44 | |
| MA50: | 161.70 | |
| MA100: | 154.57 | |
| MAexp7: | 163.96 | |
| MAexp20: | 162.16 | |
| MAexp50: | 159.92 | |
| MAexp100: | 151.23 | |
| Price / MA7: | +8.18% | |
| Price / MA20: | +8.58% | |
| Price / MA50: | +8.40% | |
| Price / MA100: | +13.40% | |
| Price / MAexp7: | +6.91% | |
| Price / MAexp20: | +8.10% | |
| Price / MAexp50: | +9.61% | |
| Price / MAexp100: | +15.91% |
News
The latest news and videos published on GE AEROSPACE at the time of the analysis were as follows:
- DGAP-News: General Electric Company: Doc re. GE files Form 8-K
- DGAP-News: General Electric Company: Dividend Declaration
- DGAP-News: GE files 424B5
- DGAP-News: GE files Form 8-K
- DGAP-News: General Electric Company: GE Files Form 10-Q
About author
Online


Add a comment
Comments
0 comments on the analysis GE AEROSPACE - Daily