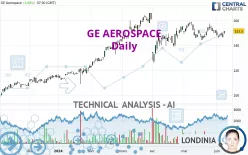
GE AEROSPACE - Daily - Technical analysis published on 06/10/2024 (GMT)
- 123
- 0
Click here for a new analysis!
- Timeframe : Daily
- - Analysis generated on
- Status : INVALID

Summary of the analysis

Additional analysis
Quotes
GE AEROSPACE rating 151.5 EUR. On the day, this instrument gained +1.68% and was between 149.5 EUR and 151.5 EUR. This implies that the price is at +1.34% from its lowest and at 0% from its highest.A bullish opening was detected by the Central Gaps scanner. Buyers are trying to impose a bullish momentum in the very short term.
Bullish opening
Type : Bullish
Timeframe : Openning
So that you have an overall view of the price change, here is a table showing the variations over several periods:
Near a new HIGH record (1 month)
Type : Bullish
Timeframe : Weekly
Technical
A technical analysis in Daily of this GE AEROSPACE chart shows a strongly bullish trend. 85.71% of the signals given by moving averages are bullish. This strongly bullish trend is supported by the strong bullish signals given by short-term moving averages. The Central Indicators scanner detects bullish signals on moving averages that could impact this trend:
Bullish trend reversal : adaptative moving average 50
Type : Bullish
Timeframe : Daily
Bullish price crossover with Moving Average 20
Type : Bullish
Timeframe : Daily
Bullish price crossover with adaptative moving average 100
Type : Bullish
Timeframe : Daily
Technical indicators are slightly bullish. There is therefore considerable uncertainty about the continuation of the increase.
Central Indicators, the scanner specialised in technical indicators, has identified these signals:
Pivot points : price is over resistance 1
Type : Neutral
Timeframe : Daily
RSI indicator is back over 50
Type : Bullish
Timeframe : Daily
Central Patterns, the market scanner focusing on chart patterns, resistances and supports found these results:
Near horizontal resistance
Type : Bearish
Timeframe : Daily
Near resistance of triangle
Type : Bearish
Timeframe : Daily
The Central Candlesticks scanner which studies Japanese candlesticks did not detect anything.
| S3 | S2 | S1 | Price | R1 | R2 | R3 | |
|---|---|---|---|---|---|---|---|
| ProTrendLines | 126.4 | 132.5 | 146.4 | 151.5 | 154.6 | 160.8 | 191.5 |
| Change (%) | -16.57% | -12.54% | -3.37% | - | +2.05% | +6.14% | +26.40% |
| Change | -25.1 | -19.0 | -5.1 | - | +3.1 | +9.3 | +40.0 |
| Level | Intermediate | Minor | Intermediate | - | Intermediate | Major | Major |
Attention could also be paid to pivot points to set price objectives:
| Pivot points | S3 | S2 | S1 | PP | R1 | R2 | R3 |
|---|---|---|---|---|---|---|---|
| Standard | 142.8 | 144.7 | 146.8 | 148.7 | 150.8 | 152.7 | 154.8 |
| Camarilla | 147.9 | 148.3 | 148.6 | 149.0 | 149.4 | 149.7 | 150.1 |
| Woodie | 143.0 | 144.8 | 147.0 | 148.8 | 151.0 | 152.8 | 155.0 |
| Fibonacci | 144.7 | 146.2 | 147.1 | 148.7 | 150.2 | 151.1 | 152.7 |
| Pivot points | S3 | S2 | S1 | PP | R1 | R2 | R3 |
|---|---|---|---|---|---|---|---|
| Standard | 138.5 | 142.0 | 145.5 | 149.0 | 152.5 | 156.0 | 159.5 |
| Camarilla | 147.1 | 147.7 | 148.4 | 149.0 | 149.6 | 150.3 | 150.9 |
| Woodie | 138.5 | 142.0 | 145.5 | 149.0 | 152.5 | 156.0 | 159.5 |
| Fibonacci | 142.0 | 144.7 | 146.3 | 149.0 | 151.7 | 153.3 | 156.0 |
| Pivot points | S3 | S2 | S1 | PP | R1 | R2 | R3 |
|---|---|---|---|---|---|---|---|
| Standard | 129.3 | 136.7 | 144.3 | 151.7 | 159.3 | 166.7 | 174.3 |
| Camarilla | 147.9 | 149.3 | 150.6 | 152.0 | 153.4 | 154.8 | 156.1 |
| Woodie | 129.5 | 136.8 | 144.5 | 151.8 | 159.5 | 166.8 | 174.5 |
| Fibonacci | 136.7 | 142.4 | 145.9 | 151.7 | 157.4 | 160.9 | 166.7 |
Numerical data
The following is the status of technical indicators and moving averages registered at the time this technical analysis was created:
| RSI (14): | 53.20 | |
| MACD (12,26,9): | -0.2000 | |
| Directional Movement: | -0.6 | |
| AROON (14): | 28.6 | |
| DEMA (21): | 150.0 | |
| Parabolic SAR (0,02-0,02-0,2): | 156.6 | |
| Elder Ray (13): | 0.6 | |
| Super Trend (3,10): | 144.3 | |
| Zig ZAG (10): | 151.5 | |
| VORTEX (21): | 0.9000 | |
| Stochastique (14,3,5): | 36.30 | |
| TEMA (21): | 149.2 | |
| Williams %R (14): | -50.00 | |
| Chande Momentum Oscillator (20): | 0.5 | |
| Repulse (5,40,3): | 1.5000 | |
| ROCnROLL: | 1 | |
| TRIX (15,9): | 0.0000 | |
| Courbe Coppock: | 0.10 |
| MA7: | 149.0 | |
| MA20: | 149.9 | |
| MA50: | 148.7 | |
| MA100: | 143.8 | |
| MAexp7: | 149.6 | |
| MAexp20: | 150.1 | |
| MAexp50: | 148.7 | |
| MAexp100: | 142.3 | |
| Price / MA7: | +1.68% | |
| Price / MA20: | +1.07% | |
| Price / MA50: | +1.88% | |
| Price / MA100: | +5.35% | |
| Price / MAexp7: | +1.27% | |
| Price / MAexp20: | +0.93% | |
| Price / MAexp50: | +1.88% | |
| Price / MAexp100: | +6.47% |
News
Don't forget to follow the news on GE AEROSPACE. At the time of publication of this analysis, the latest news was as follows:
- GE Healthcare in collaboration with Nex Cubed select six digital health start-ups for inaugural Edison Accelerator in Canada
- GE Digital Safety Solution Selected by Avelo Airlines to Drive Efficiency Outcomes Across Growing Fleet
- GE Digital’s ADMS Software Powers A More Resilient Electric Distribution Grid
- SAUDIA Airlines Contracts with GE Digital for Digital Asset Records Management
- GE Digital Joins With Airbus and Delta TechOps in Digital Alliance for Fleet Health Monitoring and Diagnostics Solutions
About author
Online


Add a comment
Comments
0 comments on the analysis GE AEROSPACE - Daily