GE AEROSPACE - 1H - Technical analysis published on 04/03/2024 (GMT)
- 145
- 0
Click here for a new analysis!
- Timeframe : 1H
- - Analysis generated on
- Status : INVALID
Summary of the analysis

Additional analysis
Quotes
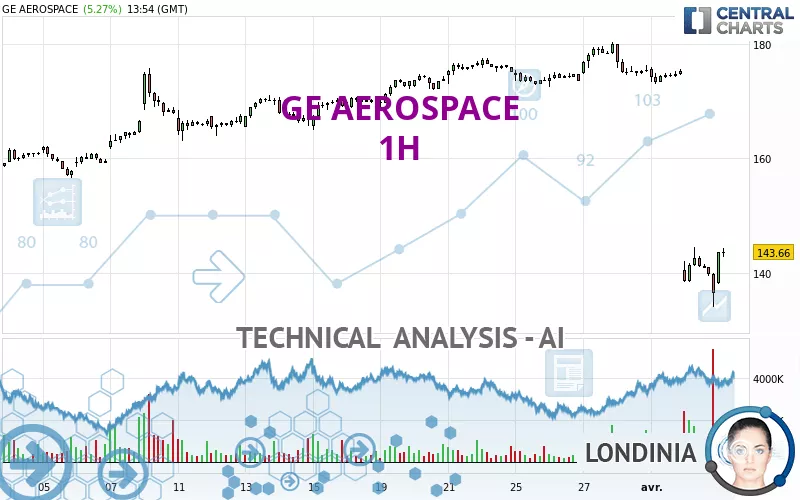
The GE AEROSPACE rating is 142.69 USD. The price registered an increase of +4.56% on the session with the lowest point at 138.01 USD and the highest point at 142.70 USD. The deviation from the price is +3.39% for the low point and -0.01% for the high point.The Central Gaps scanner detects a bullish opening marking the presence of buyers ahead of sellers at the opening but not sufficiently marked to allow the price to register a quotation gap.
Bullish opening
Type : Bullish
Timeframe : Openning
Here is a more detailed summary of the historical variations registered by GE AEROSPACE:
Near a new HIGH record (5 years)
Type : Bullish
Timeframe : Weekly
New LOW record (1 month)
Type : Bearish
Timeframe : Weekly
Technical
Technical analysis of GE AEROSPACE in 1H shows a overall strongly bearish trend. 92.86% of the signals given by moving averages are bearish. This strongly bearish trend is supported by the strong bearish signals given by short-term moving averages. The Central Indicators market scanner currently does not detect any result that concerns moving averages.
An assessment of technical indicators does not currently provide any relevant information to suggest whether the signal given by the technical indicators is more bullish or bearish.
Caution: the Central Indicators scanner currently detects an excess:
RSI indicator: bullish divergence
Type : Bullish
Timeframe : 1 hour
Williams %R indicator is oversold : under -80
Type : Neutral
Timeframe : 1 hour
Pivot points : price is under support 3
Type : Neutral
Timeframe : Weekly
Price is back over the pivot point
Type : Bullish
Timeframe : 1 hour
Central Patterns, the scanner specializing in chart patterns, did not identify any signals.
No result was found by the Central Candlesticks scanner on Japanese candlesticks.
| S3 | S2 | S1 | Price | R1 | R2 | R3 | |
|---|---|---|---|---|---|---|---|
| ProTrendLines | 106.04 | 116.69 | 122.79 | 142.69 | 144.38 | 156.74 | 162.02 |
| Change (%) | -25.69% | -18.22% | -13.95% | - | +1.18% | +9.85% | +13.55% |
| Change | -36.65 | -26.00 | -19.90 | - | +1.69 | +14.05 | +19.33 |
| Level | Minor | Major | Major | - | Minor | Minor | Minor |
Attention could also be paid to pivot points to set price objectives:
| Pivot points | S3 | S2 | S1 | PP | R1 | R2 | R3 |
|---|---|---|---|---|---|---|---|
| Standard | 121.62 | 127.80 | 132.14 | 138.32 | 142.66 | 148.84 | 153.18 |
| Camarilla | 133.58 | 134.54 | 135.51 | 136.47 | 137.43 | 138.40 | 139.36 |
| Woodie | 120.69 | 127.34 | 131.21 | 137.86 | 141.73 | 148.38 | 152.25 |
| Fibonacci | 127.80 | 131.82 | 134.31 | 138.32 | 142.34 | 144.83 | 148.84 |
| Pivot points | S3 | S2 | S1 | PP | R1 | R2 | R3 |
|---|---|---|---|---|---|---|---|
| Standard | 163.87 | 168.14 | 171.83 | 176.10 | 179.79 | 184.06 | 187.75 |
| Camarilla | 173.34 | 174.07 | 174.80 | 175.53 | 176.26 | 176.99 | 177.72 |
| Woodie | 163.59 | 168.00 | 171.55 | 175.96 | 179.51 | 183.92 | 187.47 |
| Fibonacci | 168.14 | 171.18 | 173.06 | 176.10 | 179.14 | 181.02 | 184.06 |
| Pivot points | S3 | S2 | S1 | PP | R1 | R2 | R3 |
|---|---|---|---|---|---|---|---|
| Standard | 137.51 | 147.04 | 161.29 | 170.82 | 185.07 | 194.60 | 208.85 |
| Camarilla | 168.99 | 171.17 | 173.35 | 175.53 | 177.71 | 179.89 | 182.07 |
| Woodie | 139.86 | 148.22 | 163.64 | 172.00 | 187.42 | 195.78 | 211.20 |
| Fibonacci | 147.04 | 156.13 | 161.74 | 170.82 | 179.91 | 185.52 | 194.60 |
Numerical data
The following are the details of the technical indicators and moving averages that were collected to generate this technical analysis:
| RSI (14): | 25.31 | |
| MACD (12,26,9): | -9.8700 | |
| Directional Movement: | -44.60 | |
| AROON (14): | -92.86 | |
| DEMA (21): | 144.45 | |
| Parabolic SAR (0,02-0,02-0,2): | 152.38 | |
| Elder Ray (13): | -10.00 | |
| Super Trend (3,10): | 148.83 | |
| Zig ZAG (10): | 141.28 | |
| VORTEX (21): | 0.9000 | |
| Stochastique (14,3,5): | 9.44 | |
| TEMA (21): | 137.31 | |
| Williams %R (14): | -81.27 | |
| Chande Momentum Oscillator (20): | -32.59 | |
| Repulse (5,40,3): | 1.2400 | |
| ROCnROLL: | 2 | |
| TRIX (15,9): | -0.5700 | |
| Courbe Coppock: | 37.42 |
| MA7: | 165.21 | |
| MA20: | 167.93 | |
| MA50: | 153.38 | |
| MA100: | 138.18 | |
| MAexp7: | 143.62 | |
| MAexp20: | 155.90 | |
| MAexp50: | 165.23 | |
| MAexp100: | 167.15 | |
| Price / MA7: | -13.63% | |
| Price / MA20: | -15.03% | |
| Price / MA50: | -6.97% | |
| Price / MA100: | +3.26% | |
| Price / MAexp7: | -0.65% | |
| Price / MAexp20: | -8.47% | |
| Price / MAexp50: | -13.64% | |
| Price / MAexp100: | -14.63% |
News
The last news published on GE AEROSPACE at the time of the generation of this analysis was as follows:
- DGAP-News: General Electric Company: Doc re. GE files Form 8-K
- DGAP-News: General Electric Company: Dividend Declaration
- DGAP-News: GE files 424B5
- DGAP-News: GE files Form 8-K
- DGAP-News: General Electric Company: GE Files Form 10-Q
About author
Online


Add a comment
Comments
0 comments on the analysis GE AEROSPACE - 1H