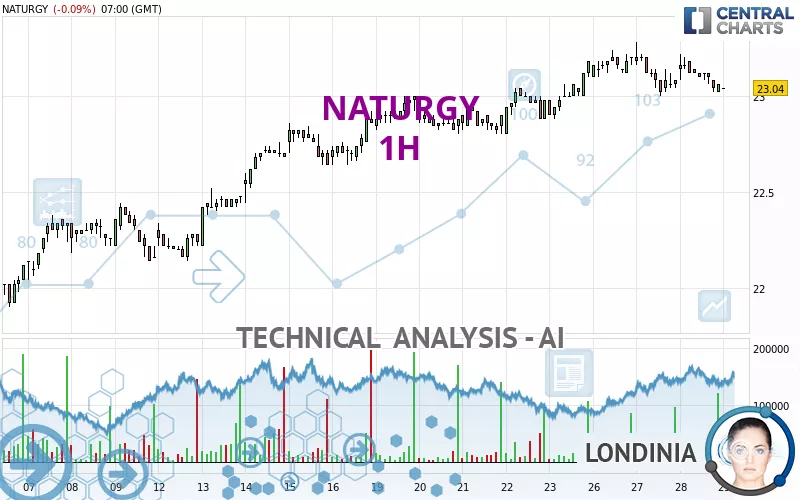
NATURGY - 1H - Technical analysis published on 08/29/2024 (GMT)
- 125
- 0
Click here for a new analysis!
- Timeframe : 1H
- - Analysis generated on
- Status : TARGET REACHED

Summary of the analysis

Additional analysis
Quotes
The NATURGY price is 23.04 EUR. The price is lower by -0.09% since the last closing with the lowest point at 23.04 EUR and the highest point at 23.04 EUR. The deviation from the price is 0% for the low point and 0% for the high point.A bullish opening was detected by the Central Gaps scanner. Buyers are trying to impose a bullish momentum in the very short term.
Bullish opening
Type : Bullish
Timeframe : Openning
So that you have an overall view of the price change, here is a table showing the variations over several periods:
Near a new HIGH record (1 month)
Type : Bullish
Timeframe : Weekly
Technical
Technical analysis of NATURGY in 1H shows an overall bullish trend. 64.29% of the signals given by moving averages are bullish. Caution: the current slightly bearish signals from short-term moving averages indicate that the overall trend may be slowing down. An assessment of moving averages reveals several bullish signals that could impact this trend:
Bullish price crossover with Moving Average 50
Type : Bullish
Timeframe : 1 hour
Bullish price crossover with adaptative moving average 20
Type : Bullish
Timeframe : 1 hour
An assessment of technical indicators does not currently provide any relevant information on the direction of future price movements.
But beware of excesses. The Central Indicators scanner currently detects this:
CCI indicator is oversold : under -100
Type : Neutral
Timeframe : 1 hour
CCI indicator: bullish divergence
Type : Bullish
Timeframe : 1 hour
RSI indicator: bullish divergence
Type : Bullish
Timeframe : 1 hour
Momentum indicator is back over 0
Type : Bullish
Timeframe : 1 hour
Central Patterns, the market scanner focusing on chart patterns, resistances and supports found this result:
Near support of channel
Type : Bullish
Timeframe : 1 hour
No result was found by the Central Candlesticks scanner on Japanese candlesticks.
| S3 | S2 | S1 | Price | R1 | R2 | R3 | |
|---|---|---|---|---|---|---|---|
| ProTrendLines | 22.13 | 22.44 | 23.00 | 23.04 | 23.22 | 23.53 | 24.47 |
| Change (%) | -3.95% | -2.60% | -0.17% | - | +0.78% | +2.13% | +6.21% |
| Change | -0.91 | -0.60 | -0.04 | - | +0.18 | +0.49 | +1.43 |
| Level | Major | Minor | Intermediate | - | Intermediate | Major | Intermediate |
Attention could also be paid to pivot points to set price objectives:
| Pivot points | S3 | S2 | S1 | PP | R1 | R2 | R3 |
|---|---|---|---|---|---|---|---|
| Standard | 22.78 | 22.90 | 22.98 | 23.10 | 23.18 | 23.30 | 23.38 |
| Camarilla | 23.01 | 23.02 | 23.04 | 23.06 | 23.08 | 23.10 | 23.12 |
| Woodie | 22.76 | 22.89 | 22.96 | 23.09 | 23.16 | 23.29 | 23.36 |
| Fibonacci | 22.90 | 22.98 | 23.02 | 23.10 | 23.18 | 23.22 | 23.30 |
| Pivot points | S3 | S2 | S1 | PP | R1 | R2 | R3 |
|---|---|---|---|---|---|---|---|
| Standard | 22.55 | 22.67 | 22.93 | 23.05 | 23.31 | 23.43 | 23.69 |
| Camarilla | 23.08 | 23.11 | 23.15 | 23.18 | 23.22 | 23.25 | 23.29 |
| Woodie | 22.61 | 22.71 | 22.99 | 23.09 | 23.37 | 23.47 | 23.75 |
| Fibonacci | 22.67 | 22.82 | 22.91 | 23.05 | 23.20 | 23.29 | 23.43 |
| Pivot points | S3 | S2 | S1 | PP | R1 | R2 | R3 |
|---|---|---|---|---|---|---|---|
| Standard | 17.74 | 18.79 | 20.49 | 21.54 | 23.24 | 24.29 | 25.99 |
| Camarilla | 21.42 | 21.68 | 21.93 | 22.18 | 22.43 | 22.68 | 22.94 |
| Woodie | 18.06 | 18.95 | 20.81 | 21.70 | 23.56 | 24.45 | 26.31 |
| Fibonacci | 18.79 | 19.84 | 20.49 | 21.54 | 22.59 | 23.24 | 24.29 |
Numerical data
The following are the details of the technical indicators and moving averages that were collected to generate this technical analysis:
| RSI (14): | 46.18 | |
| MACD (12,26,9): | 0.0000 | |
| Directional Movement: | 1.31 | |
| AROON (14): | 28.57 | |
| DEMA (21): | 23.11 | |
| Parabolic SAR (0,02-0,02-0,2): | 23.22 | |
| Elder Ray (13): | -0.06 | |
| Super Trend (3,10): | 23.01 | |
| Zig ZAG (10): | 23.06 | |
| VORTEX (21): | 0.8900 | |
| Stochastique (14,3,5): | 30.30 | |
| TEMA (21): | 23.08 | |
| Williams %R (14): | -72.73 | |
| Chande Momentum Oscillator (20): | 0.04 | |
| Repulse (5,40,3): | 0.0800 | |
| ROCnROLL: | -1 | |
| TRIX (15,9): | 0.0100 | |
| Courbe Coppock: | 0.36 |
| MA7: | 23.04 | |
| MA20: | 22.63 | |
| MA50: | 21.65 | |
| MA100: | 22.30 | |
| MAexp7: | 23.09 | |
| MAexp20: | 23.10 | |
| MAexp50: | 23.04 | |
| MAexp100: | 22.90 | |
| Price / MA7: | -0% | |
| Price / MA20: | +1.81% | |
| Price / MA50: | +6.42% | |
| Price / MA100: | +3.32% | |
| Price / MAexp7: | -0.22% | |
| Price / MAexp20: | -0.26% | |
| Price / MAexp50: | -0% | |
| Price / MAexp100: | +0.61% |
News
The latest news and videos published on NATURGY at the time of the analysis were as follows:
- Press Release From Davidson Kempner European Partners LLP Regarding its Holding in Naturgy Energy Group S.A.
- Naturgy and Sonatrach Have Entered into an Agreement With Mubadala for the Acquisition of Its Stake in Medgaz, Which Will Become Jointly Controlled by Them Upon Completion of the Transaction
- Naturgy and Sonatrach Have Entered into an Agreement With Mubadala for the Acquisition of Its Stake in Medgaz, Which Will Become Jointly Controlled by Them Upon Completion of the Transaction
- Naturgy, One of Spain's Leading Utility Companies, Signs Hybrid Cloud Services Agreement with IBM to Boost Digital Transformation
- Gas Natural Inc. Reports 2016 Fourth Quarter and Full Year Results
About author
Online


Add a comment
Comments
0 comments on the analysis NATURGY - 1H