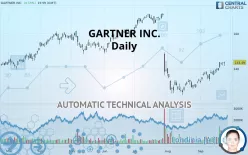
GARTNER INC. - Daily - Technical analysis published on 09/25/2019 (GMT)
- 251
- 0
- Who voted?
Click here for a new analysis!
- Timeframe : Daily
- - Analysis generated on
- Status : INVALID

Summary of the analysis

Additional analysis
Quotes
The GARTNER INC. rating is 143.49 USD. The price registered an increase of +0.15% on the session and was between 141.42 USD and 143.88 USD. This implies that the price is at +1.46% from its lowest and at -0.27% from its highest.The Central Gaps scanner detects a bearish opening. A small advantage for sellers in the very short term.
Bearish opening
Type : Bearish
Timeframe : Openning
So that you have an overall view of the price change, here is a table showing the variations over several periods:
Technical
A technical analysis in Daily of this GARTNER INC. chart shows a slightly bearish trend. Only 57.14% of the signals given by moving averages are bearish. This slightly bearish trend could quickly be reversed due to the strong bullish signals currently being given by short-term moving averages. There is no crossing of moving average by the price or crossing of moving averages between themselves.
Technical indicators are strongly bullish, suggesting that the price increase should continue.
Caution: the Central Indicators scanner currently detects an excess:
CCI indicator is overbought : over 100
Type : Neutral
Timeframe : Daily
Williams %R indicator is overbought : over -20
Type : Neutral
Timeframe : Daily
Price is back over the pivot point
Type : Bullish
Timeframe : Weekly
An analysis of the price chart with the Central Patterns scanner (detector of chart patterns and resistances and supports) shows several results that can have an impact on the price change:
Near resistance of channel
Type : Bearish
Timeframe : Daily
Near horizontal support
Type : Bullish
Timeframe : Daily
The Central Candlesticks scanner, specialised in Japanese candlesticks, did not identify any signals.
| S3 | S2 | S1 | Price | R1 | R2 | R3 | |
|---|---|---|---|---|---|---|---|
| ProTrendLines | 123.17 | 137.19 | 142.14 | 143.49 | 149.90 | 155.00 | 160.00 |
| Change (%) | -14.16% | -4.39% | -0.94% | - | +4.47% | +8.02% | +11.51% |
| Change | -20.32 | -6.30 | -1.35 | - | +6.41 | +11.51 | +16.51 |
| Level | Major | Minor | Major | - | Intermediate | Minor | Major |
Pivot points can also be used to set your price objectives. Here is the price situation in relation to pivot points:
| Pivot points | S3 | S2 | S1 | PP | R1 | R2 | R3 |
|---|---|---|---|---|---|---|---|
| Standard | 140.67 | 141.28 | 142.28 | 142.88 | 143.88 | 144.49 | 145.49 |
| Camarilla | 142.84 | 142.99 | 143.13 | 143.28 | 143.43 | 143.57 | 143.72 |
| Woodie | 140.87 | 141.38 | 142.48 | 142.98 | 144.08 | 144.59 | 145.69 |
| Fibonacci | 141.28 | 141.89 | 142.27 | 142.88 | 143.50 | 143.87 | 144.49 |
| Pivot points | S3 | S2 | S1 | PP | R1 | R2 | R3 |
|---|---|---|---|---|---|---|---|
| Standard | 130.81 | 133.42 | 138.53 | 141.15 | 146.26 | 148.87 | 153.98 |
| Camarilla | 141.52 | 142.22 | 142.93 | 143.64 | 144.35 | 145.06 | 145.76 |
| Woodie | 132.05 | 134.04 | 139.78 | 141.77 | 147.50 | 149.49 | 155.23 |
| Fibonacci | 133.42 | 136.37 | 138.19 | 141.15 | 144.10 | 145.92 | 148.87 |
| Pivot points | S3 | S2 | S1 | PP | R1 | R2 | R3 |
|---|---|---|---|---|---|---|---|
| Standard | 109.94 | 117.36 | 125.51 | 132.93 | 141.08 | 148.50 | 156.65 |
| Camarilla | 129.39 | 130.82 | 132.24 | 133.67 | 135.10 | 136.52 | 137.95 |
| Woodie | 110.32 | 117.54 | 125.89 | 133.11 | 141.46 | 148.68 | 157.03 |
| Fibonacci | 117.36 | 123.30 | 126.98 | 132.93 | 138.87 | 142.55 | 148.50 |
Numerical data
The following is the status of technical indicators and moving averages registered at the time this technical analysis was created:
| RSI (14): | 63.68 | |
| MACD (12,26,9): | 1.4300 | |
| Directional Movement: | 6.22 | |
| AROON (14): | 71.43 | |
| DEMA (21): | 139.89 | |
| Parabolic SAR (0,02-0,02-0,2): | 140.32 | |
| Elder Ray (13): | 2.66 | |
| Super Trend (3,10): | 135.39 | |
| Zig ZAG (10): | 143.49 | |
| VORTEX (21): | 1.1700 | |
| Stochastique (14,3,5): | 93.90 | |
| TEMA (21): | 143.86 | |
| Williams %R (14): | -3.56 | |
| Chande Momentum Oscillator (20): | 6.57 | |
| Repulse (5,40,3): | 2.4300 | |
| ROCnROLL: | 1 | |
| TRIX (15,9): | 0.0300 | |
| Courbe Coppock: | 11.30 |
| MA7: | 141.67 | |
| MA20: | 137.55 | |
| MA50: | 140.52 | |
| MA100: | 149.50 | |
| MAexp7: | 141.75 | |
| MAexp20: | 138.91 | |
| MAexp50: | 141.22 | |
| MAexp100: | 145.15 | |
| Price / MA7: | +1.28% | |
| Price / MA20: | +4.32% | |
| Price / MA50: | +2.11% | |
| Price / MA100: | -4.02% | |
| Price / MAexp7: | +1.23% | |
| Price / MAexp20: | +3.30% | |
| Price / MAexp50: | +1.61% | |
| Price / MAexp100: | -1.14% |
News
The last news published on GARTNER INC. at the time of the generation of this analysis was as follows:
- Zensar Technologies Positioned in the 2016 Gartner Magic Quadrant for Managed Mobility Services
- Mimecast Named a Leader in the 2016 Gartner Magic Quadrant for Enterprise Information Archiving
- Velocity Listed as an SAP Specialist for Delivering SAP Services in the Cloud by Gartner
- West Positioned as a Niche Player in Gartner CCaaS Magic Quadrant, North America
- Robin Systems’ Sushil Kumar to Present at Gartner Data Center, Infrastructure & Operations Management Conference
About author

Online


Add a comment
Comments
0 comments on the analysis GARTNER INC. - Daily