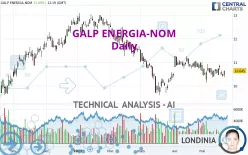
GALP ENERGIA-NOM - Daily - Technical analysis published on 05/23/2023 (GMT)
- 146
- 0
- Timeframe : Daily
- - Analysis generated on
- Status : NEUTRAL

Summary of the analysis

Additional analysis
Quotes
GALP ENERGIA-NOM rating 10.645 EUR. The price registered an increase of +1.43% on the session and was traded between 10.365 EUR and 10.645 EUR over the period. The price is currently at +2.70% from its lowest and 0% from its highest.Here is a more detailed summary of the historical variations registered by GALP ENERGIA-NOM:
Near a new LOW record (1 month)
Type : Bearish
Timeframe : Weekly
Technical
Technical analysis of this Daily chart of GALP ENERGIA-NOM indicates that the overall trend is not clearly defined. This indecision could turn into a bullish trend due to the slightly bullish signals currently given by short-term moving averages. The Central Indicators scanner detects a bullish signal on moving averages that could impact this trend:
Bullish price crossover with adaptative moving average 50
Type : Bullish
Timeframe : Daily
In fact, 11 technical indicators on 18 studied are currently positioned bullish. Caution: the Central Indicators scanner currently detects an excess:
Williams %R indicator is overbought : over -20
Type : Neutral
Timeframe : Daily
Pivot points : price is over resistance 2
Type : Neutral
Timeframe : Daily
MACD indicator is back over 0
Type : Bullish
Timeframe : Daily
Price is back over the pivot point
Type : Bullish
Timeframe : Weekly
An analysis of the price chart with the Central Patterns scanner (detector of chart patterns and resistances and supports) shows several results that can have an impact on the price change:
Near horizontal resistance
Type : Bearish
Timeframe : Daily
Resistance of channel is broken
Type : Bullish
Timeframe : Daily
Resistance of triangle is broken
Type : Bullish
Timeframe : Daily
No result was found by the Central Candlesticks scanner on Japanese candlesticks.
| S3 | S2 | S1 | Price | R1 | R2 | R3 | |
|---|---|---|---|---|---|---|---|
| ProTrendLines | 9.458 | 9.920 | 10.222 | 10.645 | 10.712 | 12.227 | 12.692 |
| Change (%) | -11.15% | -6.81% | -3.97% | - | +0.63% | +14.86% | +19.23% |
| Change | -1.187 | -0.725 | -0.423 | - | +0.067 | +1.582 | +2.047 |
| Level | Major | Intermediate | Major | - | Major | Major | Intermediate |
Pivot points can also be used to set your price objectives. Here is the price situation in relation to pivot points:
| Pivot points | S3 | S2 | S1 | PP | R1 | R2 | R3 |
|---|---|---|---|---|---|---|---|
| Standard | 10.282 | 10.338 | 10.417 | 10.473 | 10.552 | 10.608 | 10.687 |
| Camarilla | 10.458 | 10.470 | 10.483 | 10.495 | 10.507 | 10.520 | 10.532 |
| Woodie | 10.293 | 10.344 | 10.428 | 10.479 | 10.563 | 10.614 | 10.698 |
| Fibonacci | 10.338 | 10.390 | 10.422 | 10.473 | 10.525 | 10.557 | 10.608 |
| Pivot points | S3 | S2 | S1 | PP | R1 | R2 | R3 |
|---|---|---|---|---|---|---|---|
| Standard | 9.798 | 10.001 | 10.240 | 10.443 | 10.682 | 10.885 | 11.124 |
| Camarilla | 10.359 | 10.399 | 10.440 | 10.480 | 10.521 | 10.561 | 10.602 |
| Woodie | 9.817 | 10.010 | 10.259 | 10.452 | 10.701 | 10.894 | 11.143 |
| Fibonacci | 10.001 | 10.170 | 10.274 | 10.443 | 10.612 | 10.716 | 10.885 |
| Pivot points | S3 | S2 | S1 | PP | R1 | R2 | R3 |
|---|---|---|---|---|---|---|---|
| Standard | 9.831 | 10.120 | 10.422 | 10.711 | 11.013 | 11.302 | 11.604 |
| Camarilla | 10.563 | 10.617 | 10.671 | 10.725 | 10.779 | 10.833 | 10.888 |
| Woodie | 9.839 | 10.123 | 10.430 | 10.714 | 11.021 | 11.305 | 11.612 |
| Fibonacci | 10.120 | 10.345 | 10.485 | 10.711 | 10.936 | 11.076 | 11.302 |
Numerical data
The following is the status of the technical indicators and moving averages at the time of publication of this technical analysis:
| RSI (14): | 54.86 | |
| MACD (12,26,9): | 0.0010 | |
| Directional Movement: | -2.014 | |
| AROON (14): | 7.143 | |
| DEMA (21): | 10.453 | |
| Parabolic SAR (0,02-0,02-0,2): | 10.030 | |
| Elder Ray (13): | 0.033 | |
| Super Trend (3,10): | 10.078 | |
| Zig ZAG (10): | 10.630 | |
| VORTEX (21): | 0.9530 | |
| Stochastique (14,3,5): | 81.05 | |
| TEMA (21): | 10.501 | |
| Williams %R (14): | -4.71 | |
| Chande Momentum Oscillator (20): | 0.319 | |
| Repulse (5,40,3): | 3.1310 | |
| ROCnROLL: | 1 | |
| TRIX (15,9): | -0.0270 | |
| Courbe Coppock: | 0.31 |
| MA7: | 10.484 | |
| MA20: | 10.437 | |
| MA50: | 10.348 | |
| MA100: | 11.078 | |
| MAexp7: | 10.499 | |
| MAexp20: | 10.463 | |
| MAexp50: | 10.563 | |
| MAexp100: | 10.750 | |
| Price / MA7: | +1.54% | |
| Price / MA20: | +1.99% | |
| Price / MA50: | +2.87% | |
| Price / MA100: | -3.91% | |
| Price / MAexp7: | +1.39% | |
| Price / MAexp20: | +1.74% | |
| Price / MAexp50: | +0.78% | |
| Price / MAexp100: | -0.98% |
News
The latest news and videos published on GALP ENERGIA-NOM at the time of the analysis were as follows:
- NextDecade and Galp Execute 1.0 MTPA LNG Sale and Purchase Agreement
- GOWITHFLOW, BACKED BY GALP ENERGIA, SUCCESSFUL IN UNIVERSITY OF MEMPHIS-LED INNOVATION COALITION
- Venture Global LNG enters into LNG Sales and Purchase Agreement with Galp for 1 Million Tonnes Per Year
- Venture Global LNG enters into LNG Sales and Purchase Agreement with Galp for 1 Million Tonnes Per Year
-
 Galp Energia
About author
Online


Add a comment
Comments
0 comments on the analysis GALP ENERGIA-NOM - Daily