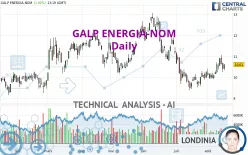
GALP ENERGIA-NOM - Daily - Technical analysis published on 08/16/2022 (GMT)
- 186
- 0
- Timeframe : Daily
- - Analysis generated on
- Status : NEUTRAL

Summary of the analysis

Additional analysis
Quotes
The GALP ENERGIA-NOM rating is 10.610 EUR. The price registered an increase of +1.92% on the session and was traded between 10.350 EUR and 10.630 EUR over the period. The price is currently at +2.51% from its lowest and -0.19% from its highest.The Central Gaps scanner detects a bullish opening marking the presence of buyers ahead of sellers at the opening but not sufficiently marked to allow the price to register a quotation gap.
Bullish opening
Type : Bullish
Timeframe : Openning
So that you have an overall view of the price change, here is a table showing the variations over several periods:
Near a new HIGH record (1 month)
Type : Bullish
Timeframe : Weekly
Technical
Technical analysis of GALP ENERGIA-NOM in Daily shows a neutral overall trend. This indecision could turn into a bullish trend due to the bullish signals currently being given by short-term moving averages. An assessment of moving averages reveals a bullish signal that could impact this trend:
Bullish price crossover with adaptative moving average 20
Type : Bullish
Timeframe : Daily
The probability of a further increase are moderate given the direction of the technical indicators.
Central Indicators, the detector scanner for these technical indicators has recently detected several signals:
Price is back over the pivot point
Type : Bullish
Timeframe : Daily
Price is back under the pivot point
Type : Bearish
Timeframe : Weekly
Williams %R indicator is back over -50
Type : Bullish
Timeframe : Daily
No signals are given by Central Patterns, a market scanner specialised in chart patterns, resistances and supports.
The presence of a bullish Japanese candlestick pattern detected by Central Candlesticks that could cause a very short term rebound was also detected:
Bullish harami
Type : Bullish
Timeframe : Daily
| S3 | S2 | S1 | Price | R1 | R2 | R3 | |
|---|---|---|---|---|---|---|---|
| ProTrendLines | 8.990 | 9.490 | 9.908 | 10.610 | 11.258 | 11.700 | 12.719 |
| Change (%) | -15.27% | -10.56% | -6.62% | - | +6.11% | +10.27% | +19.88% |
| Change | -1.620 | -1.120 | -0.702 | - | +0.648 | +1.090 | +2.109 |
| Level | Minor | Intermediate | Major | - | Major | Intermediate | Major |
Attention could also be paid to pivot points to set price objectives:
| Pivot points | S3 | S2 | S1 | PP | R1 | R2 | R3 |
|---|---|---|---|---|---|---|---|
| Standard | 9.767 | 10.013 | 10.212 | 10.458 | 10.657 | 10.903 | 11.102 |
| Camarilla | 10.288 | 10.328 | 10.369 | 10.410 | 10.451 | 10.492 | 10.532 |
| Woodie | 9.743 | 10.001 | 10.188 | 10.446 | 10.633 | 10.891 | 11.078 |
| Fibonacci | 10.013 | 10.183 | 10.288 | 10.458 | 10.628 | 10.733 | 10.903 |
| Pivot points | S3 | S2 | S1 | PP | R1 | R2 | R3 |
|---|---|---|---|---|---|---|---|
| Standard | 9.257 | 9.703 | 10.172 | 10.618 | 11.087 | 11.533 | 12.002 |
| Camarilla | 10.388 | 10.472 | 10.556 | 10.640 | 10.724 | 10.808 | 10.892 |
| Woodie | 9.268 | 9.709 | 10.183 | 10.624 | 11.098 | 11.539 | 12.013 |
| Fibonacci | 9.703 | 10.053 | 10.269 | 10.618 | 10.968 | 11.184 | 11.533 |
| Pivot points | S3 | S2 | S1 | PP | R1 | R2 | R3 |
|---|---|---|---|---|---|---|---|
| Standard | 7.550 | 8.466 | 9.373 | 10.289 | 11.196 | 12.112 | 13.019 |
| Camarilla | 9.779 | 9.946 | 10.113 | 10.280 | 10.447 | 10.614 | 10.781 |
| Woodie | 7.546 | 8.464 | 9.369 | 10.287 | 11.192 | 12.110 | 13.015 |
| Fibonacci | 8.466 | 9.162 | 9.593 | 10.289 | 10.985 | 11.416 | 12.112 |
Numerical data
The following are the details of the technical indicators and moving averages that were collected to generate this technical analysis:
| RSI (14): | 54.24 | |
| MACD (12,26,9): | 0.0390 | |
| Directional Movement: | 4.595 | |
| AROON (14): | 78.571 | |
| DEMA (21): | 10.334 | |
| Parabolic SAR (0,02-0,02-0,2): | 10.102 | |
| Elder Ray (13): | 0.093 | |
| Super Trend (3,10): | 9.809 | |
| Zig ZAG (10): | 10.605 | |
| VORTEX (21): | 1.0680 | |
| Stochastique (14,3,5): | 56.46 | |
| TEMA (21): | 10.572 | |
| Williams %R (14): | -38.59 | |
| Chande Momentum Oscillator (20): | 0.330 | |
| Repulse (5,40,3): | 0.7230 | |
| ROCnROLL: | 1 | |
| TRIX (15,9): | -0.1040 | |
| Courbe Coppock: | 10.82 |
| MA7: | 10.559 | |
| MA20: | 10.196 | |
| MA50: | 10.707 | |
| MA100: | 10.978 | |
| MAexp7: | 10.508 | |
| MAexp20: | 10.354 | |
| MAexp50: | 10.538 | |
| MAexp100: | 10.604 | |
| Price / MA7: | +0.48% | |
| Price / MA20: | +4.06% | |
| Price / MA50: | -0.91% | |
| Price / MA100: | -3.35% | |
| Price / MAexp7: | +0.97% | |
| Price / MAexp20: | +2.47% | |
| Price / MAexp50: | +0.68% | |
| Price / MAexp100: | +0.06% |
News
The last news published on GALP ENERGIA-NOM at the time of the generation of this analysis was as follows:
- GOWITHFLOW, BACKED BY GALP ENERGIA, SUCCESSFUL IN UNIVERSITY OF MEMPHIS-LED INNOVATION COALITION
-
 Savannah Resources team up with 'ideal candidate for partnership' Galp on flagship lithium project
- Venture Global LNG enters into LNG Sales and Purchase Agreement with Galp for 1 Million Tonnes Per Year
- Venture Global LNG enters into LNG Sales and Purchase Agreement with Galp for 1 Million Tonnes Per Year
-
Galp Energia
About author
Online


Add a comment
Comments
0 comments on the analysis GALP ENERGIA-NOM - Daily