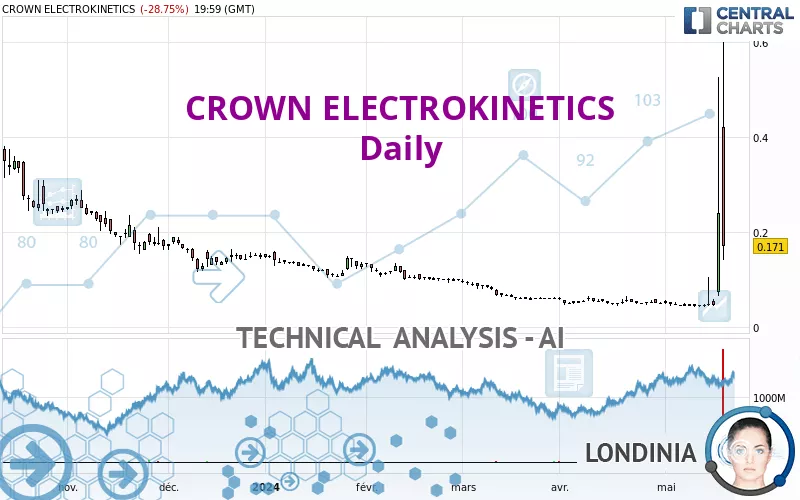
CROWN ELECTROKINETICS - Daily - Technical analysis published on 05/18/2024 (GMT)
- 164
- 0
Click here for a new analysis!
- Timeframe : Daily
- - Analysis generated on
- Status : INVALID
Summary of the analysis
Additional analysis
Quotes
The CROWN ELECTROKINETICS rating is 0.1710 USD. The price registered a decrease of -28.75% on the session with the lowest point at 0.1410 USD and the highest point at 0.6000 USD. The deviation from the price is +21.28% for the low point and -71.50% for the high point.Here is a more detailed summary of the historical variations registered by CROWN ELECTROKINETICS:
Near a new LOW record (5 years)
Type : Bearish
Timeframe : Weekly
New HIGH record (1st january)
Type : Bullish
Timeframe : Weekly
New HIGH record (1 month)
Type : Bullish
Timeframe : Weekly
The Central Volumes scanner notes the presence of abnormal volumes:
Abnormal volumes
Timeframe : 5 days
Abnormal volumes
Timeframe : 20 days
Abnormal volumes
Timeframe : 50 days
Technical
A technical analysis in Daily of this CROWN ELECTROKINETICS chart shows a bullish trend. The signals returned by the moving averages are 64.29% bullish. This bullish trend is reinforced by the strong signals currently being given by short-term moving averages. An assessment of moving averages reveals several bullish signals that could impact this trend:
Bullish trend reversal : Moving Average 20
Type : Bullish
Timeframe : Daily
Bullish trend reversal : Moving Average 50
Type : Bullish
Timeframe : Daily
Bullish trend reversal : Moving Average 100
Type : Bullish
Timeframe : Daily
Bullish trend reversal : adaptative moving average 20
Type : Bullish
Timeframe : Daily
Bullish trend reversal : adaptative moving average 50
Type : Bullish
Timeframe : Daily
Moving Average bullish crossovers : MA20 & MA50
Type : Bullish
Timeframe : Daily
The probability of a further increase are moderate given the direction of the technical indicators.
Caution: the Central Indicators scanner currently detects an excess:
CCI indicator is overbought : over 100
Type : Neutral
Timeframe : Daily
Previous candle closed over Bollinger bands
Type : Neutral
Timeframe : Daily
Pivot points : price is over resistance 3
Type : Neutral
Timeframe : Weekly
Price is back under the pivot point
Type : Bearish
Timeframe : Daily
The analysis of the price chart with Central Patterns scanners does not return any result.
The presence of a bearish pattern in Japanese candlesticks detected by Central Candlesticks that could cause a correction in the very short term was also detected:
Long black line
Type : Bearish
Timeframe : Daily
| S1 | Price | R1 | R2 | R3 | |
|---|---|---|---|---|---|
| ProTrendLines | 0.1277 | 0.1710 | 0.8196 | 1.6550 | 3.4740 |
| Change (%) | -25.32% | - | +379.30% | +867.84% | +1,931.58% |
| Change | -0.0433 | - | +0.6486 | +1.4840 | +3.3030 |
| Level | Major | - | Minor | Minor | Major |
Pivot points can also be used to set your price objectives. Here is the price situation in relation to pivot points:
| Pivot points | S3 | S2 | S1 | PP | R1 | R2 | R3 |
|---|---|---|---|---|---|---|---|
| Standard | -0.4510 | -0.1550 | 0.0080 | 0.3040 | 0.4670 | 0.7630 | 0.9260 |
| Camarilla | 0.0448 | 0.0869 | 0.1289 | 0.1710 | 0.2131 | 0.2552 | 0.2972 |
| Woodie | -0.5175 | -0.1883 | -0.0585 | 0.2708 | 0.4005 | 0.7298 | 0.8595 |
| Fibonacci | -0.1550 | 0.0203 | 0.1287 | 0.3040 | 0.4793 | 0.5877 | 0.7630 |
| Pivot points | S3 | S2 | S1 | PP | R1 | R2 | R3 |
|---|---|---|---|---|---|---|---|
| Standard | -0.6163 | -0.2873 | -0.0581 | 0.2709 | 0.5001 | 0.8291 | 1.0583 |
| Camarilla | 0.0175 | 0.0687 | 0.1198 | 0.1710 | 0.2222 | 0.2733 | 0.3245 |
| Woodie | -0.6663 | -0.3123 | -0.1081 | 0.2460 | 0.4501 | 0.8042 | 1.0083 |
| Fibonacci | -0.2873 | -0.0740 | 0.0577 | 0.2709 | 0.4842 | 0.6159 | 0.8291 |
| Pivot points | S3 | S2 | S1 | PP | R1 | R2 | R3 |
|---|---|---|---|---|---|---|---|
| Standard | 0.0196 | 0.0316 | 0.0408 | 0.0528 | 0.0620 | 0.0740 | 0.0832 |
| Camarilla | 0.0441 | 0.0460 | 0.0480 | 0.0499 | 0.0518 | 0.0538 | 0.0557 |
| Woodie | 0.0181 | 0.0309 | 0.0393 | 0.0521 | 0.0605 | 0.0733 | 0.0817 |
| Fibonacci | 0.0316 | 0.0397 | 0.0447 | 0.0528 | 0.0609 | 0.0659 | 0.0740 |
Numerical data
The following are the details of the technical indicators and moving averages that were collected to generate this technical analysis:
| RSI (14): | 69.01 | |
| MACD (12,26,9): | 0.0188 | |
| Directional Movement: | 54.1756 | |
| AROON (14): | 42.8571 | |
| DEMA (21): | 0.0940 | |
| Parabolic SAR (0,02-0,02-0,2): | 0.0441 | |
| Elder Ray (13): | 0.2824 | |
| Super Trend (3,10): | 0.1197 | |
| Zig ZAG (10): | 0.1701 | |
| VORTEX (21): | 1.0652 | |
| Stochastique (14,3,5): | 23.86 | |
| TEMA (21): | 0.1167 | |
| Williams %R (14): | -76.80 | |
| Chande Momentum Oscillator (20): | 0.1222 | |
| Repulse (5,40,3): | -276.0802 | |
| ROCnROLL: | 1 | |
| TRIX (15,9): | 0.6662 | |
| Courbe Coppock: | 204.76 |
| MA7: | 0.0915 | |
| MA20: | 0.0629 | |
| MA50: | 0.0602 | |
| MA100: | 0.0895 | |
| MAexp7: | 0.1137 | |
| MAexp20: | 0.0767 | |
| MAexp50: | 0.0758 | |
| MAexp100: | 0.3046 | |
| Price / MA7: | +86.89% | |
| Price / MA20: | +171.86% | |
| Price / MA50: | +184.05% | |
| Price / MA100: | +91.06% | |
| Price / MAexp7: | +50.40% | |
| Price / MAexp20: | +122.95% | |
| Price / MAexp50: | +125.59% | |
| Price / MAexp100: | -43.86% |
News
Don't forget to follow the news on CROWN ELECTROKINETICS. At the time of publication of this analysis, the latest news was as follows:
- Crown Electrokinetics Issues Letter to Shareholders
- Crown Fiber Optics Secures New $85 Million Project
- Crown Electrokinetics Completes Restructuring of Balance Sheet
- Crown Fiber Optics Secures New $50 Million Contract
- Crown’s Fiber Optics Secures Fourth Contract for Fiber Optics Division
About author

Online


Add a comment
Comments
0 comments on the analysis CROWN ELECTROKINETICS - Daily