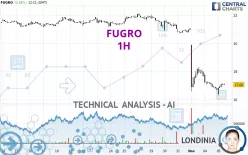
FUGRO - 1H - Technical analysis published on 11/05/2024 (GMT)
- 95
- 0
Click here for a new analysis!
- Timeframe : 1H
- - Analysis generated on
- Status : TARGET REACHED

Summary of the analysis

Additional analysis
Quotes
The FUGRO rating is 17.06 EUR. The price registered an increase of +2.28% on the session with the lowest point at 16.30 EUR and the highest point at 17.12 EUR. The deviation from the price is +4.66% for the low point and -0.35% for the high point.The Central Gaps scanner detects a bearish gap which is a sign that the sellers have taken the lead in the very short term.
Opening Gap DOWN
Type : Bearish
Timeframe : Openning
A study of price movements over other periods shows the following variations:
Near a new LOW record (1 year)
Type : Bearish
Timeframe : Weekly
Near a new LOW record (1st january)
Type : Bearish
Timeframe : Weekly
New LOW record (1 month)
Type : Bearish
Timeframe : Weekly
The Central Volumes scanner notes the presence of abnormal volumes:
Abnormal volumes
Timeframe : 5 days
Technical
Technical analysis of FUGRO in 1H shows a overall strongly bearish trend. 92.86% of the signals given by moving averages are bearish. The overall trend is supported by the strong bearish signals from short-term moving averages. There is no crossing of moving average by the price or crossing of moving averages between themselves.
An assessment of technical indicators does not currently provide any relevant information on the direction of future price movements.
The Central Indicators scanner found this result concerning these indicators:
Williams %R indicator is back over -50
Type : Bullish
Timeframe : 1 hour
Central Patterns, the market scanner focusing on chart patterns, resistances and supports found this result:
Near resistance of channel
Type : Bearish
Timeframe : 1 hour
There is also a Japanese candlestick pattern detected by Central Candlesticks that could mark the end of the current short-term trend:
Doji
Type : Neutral
Timeframe : 1 hour
| S3 | S2 | S1 | Price | R1 | R2 | R3 | |
|---|---|---|---|---|---|---|---|
| ProTrendLines | 10.14 | 13.47 | 16.29 | 17.06 | 18.32 | 20.70 | 21.17 |
| Change (%) | -40.56% | -21.04% | -4.51% | - | +7.39% | +21.34% | +24.09% |
| Change | -6.92 | -3.59 | -0.77 | - | +1.26 | +3.64 | +4.11 |
| Level | Intermediate | Intermediate | Major | - | Minor | Major | Major |
Attention could also be paid to pivot points to set price objectives:
| Pivot points | S3 | S2 | S1 | PP | R1 | R2 | R3 |
|---|---|---|---|---|---|---|---|
| Standard | 15.13 | 15.91 | 16.29 | 17.07 | 17.45 | 18.23 | 18.61 |
| Camarilla | 16.36 | 16.47 | 16.57 | 16.68 | 16.79 | 16.89 | 17.00 |
| Woodie | 14.94 | 15.81 | 16.10 | 16.97 | 17.26 | 18.13 | 18.42 |
| Fibonacci | 15.91 | 16.35 | 16.62 | 17.07 | 17.51 | 17.78 | 18.23 |
| Pivot points | S3 | S2 | S1 | PP | R1 | R2 | R3 |
|---|---|---|---|---|---|---|---|
| Standard | 9.83 | 13.20 | 15.42 | 18.79 | 21.01 | 24.38 | 26.60 |
| Camarilla | 16.10 | 16.62 | 17.13 | 17.64 | 18.15 | 18.67 | 19.18 |
| Woodie | 9.26 | 12.91 | 14.85 | 18.50 | 20.44 | 24.09 | 26.03 |
| Fibonacci | 13.20 | 15.34 | 16.66 | 18.79 | 20.93 | 22.25 | 24.38 |
| Pivot points | S3 | S2 | S1 | PP | R1 | R2 | R3 |
|---|---|---|---|---|---|---|---|
| Standard | 18.06 | 19.10 | 20.08 | 21.12 | 22.10 | 23.14 | 24.12 |
| Camarilla | 20.51 | 20.69 | 20.88 | 21.06 | 21.25 | 21.43 | 21.62 |
| Woodie | 18.03 | 19.09 | 20.05 | 21.11 | 22.07 | 23.13 | 24.09 |
| Fibonacci | 19.10 | 19.87 | 20.35 | 21.12 | 21.89 | 22.37 | 23.14 |
Numerical data
The following are the details of the technical indicators and moving averages that were collected to generate this technical analysis:
| RSI (14): | 31.88 | |
| MACD (12,26,9): | -0.7500 | |
| Directional Movement: | -31.36 | |
| AROON (14): | -78.57 | |
| DEMA (21): | 16.48 | |
| Parabolic SAR (0,02-0,02-0,2): | 19.36 | |
| Elder Ray (13): | -0.13 | |
| Super Trend (3,10): | 17.61 | |
| Zig ZAG (10): | 17.10 | |
| VORTEX (21): | 1.0600 | |
| Stochastique (14,3,5): | 40.33 | |
| TEMA (21): | 16.47 | |
| Williams %R (14): | -52.66 | |
| Chande Momentum Oscillator (20): | -0.12 | |
| Repulse (5,40,3): | 2.0500 | |
| ROCnROLL: | 2 | |
| TRIX (15,9): | -0.6900 | |
| Courbe Coppock: | 9.62 |
| MA7: | 19.53 | |
| MA20: | 20.79 | |
| MA50: | 20.84 | |
| MA100: | 21.90 | |
| MAexp7: | 16.99 | |
| MAexp20: | 17.55 | |
| MAexp50: | 18.92 | |
| MAexp100: | 19.91 | |
| Price / MA7: | -12.65% | |
| Price / MA20: | -17.94% | |
| Price / MA50: | -18.14% | |
| Price / MA100: | -22.10% | |
| Price / MAexp7: | +0.41% | |
| Price / MAexp20: | -2.79% | |
| Price / MAexp50: | -9.83% | |
| Price / MAexp100: | -14.31% |
News
The latest news and videos published on FUGRO at the time of the analysis were as follows:
- Global Marine Group to Acquire Fugro's Trenching and Cable Laying Business
-
 Fugro
Fugro
- Leidos Is Exclusive North American Provider of Fugro's Roames Utility Asset Management
About author
Online


Add a comment
Comments
0 comments on the analysis FUGRO - 1H