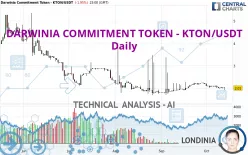
DARWINIA COMMITMENT TOKEN - KTON/USDT - Daily - Technical analysis published on 10/13/2024 (GMT)
- 151
- 0
Click here for a new analysis!
- Timeframe : Daily
- - Analysis generated on
- Status : INVALID

Summary of the analysis

Additional analysis
Quotes
The DARWINIA COMMITMENT TOKEN - KTON/USDT rating is 2.01 USDT. On the day, this instrument lost -1.95% with the lowest point at 1.93 USDT and the highest point at 2.05 USDT. The deviation from the price is +4.15% for the low point and -1.95% for the high point.A study of price movements over other periods shows the following variations:
New LOW record (1st january)
Type : Bearish
Timeframe : Weekly
Near a new LOW record (1 month)
Type : Bearish
Timeframe : Weekly
Technical
A technical analysis in Daily of this DARWINIA COMMITMENT TOKEN - KTON/USDT chart shows a sharp bearish trend. 82.14% of the signals given by moving averages are bearish. This strongly bearish trend is supported by the strong bearish signals given by short-term moving averages. The Central Indicators market scanner is currently detecting several bearish signals that could impact this trend:
Bearish price crossover with Moving Average 50
Type : Bearish
Timeframe : Daily
Bearish price crossover with adaptative moving average 50
Type : Bearish
Timeframe : Daily
In fact, according to the parameters integrated into the Central Analyzer system, 11 technical indicators out of 18 analysed are currently bearish. But beware of excesses. The Central Indicators scanner currently detects this:
CCI indicator is oversold : under -100
Type : Neutral
Timeframe : Daily
Pivot points : price is under support 1
Type : Neutral
Timeframe : Daily
The analysis of the price chart with Central Patterns scanners does not return any result.
The Central Candlesticks scanner which studies Japanese candlesticks did not detect anything.
| S1 | Price | R1 | R2 | R3 | |
|---|---|---|---|---|---|
| ProTrendLines | 1.79 | 2.01 | 2.25 | 2.89 | 3.57 |
| Change (%) | -10.95% | - | +11.94% | +43.78% | +77.61% |
| Change | -0.22 | - | +0.24 | +0.88 | +1.56 |
| Level | Intermediate | - | Minor | Minor | Intermediate |
To determine price objectives, it is also possible to use the pivot points. Here is the price position in relation to pivot points:
| Pivot points | S3 | S2 | S1 | PP | R1 | R2 | R3 |
|---|---|---|---|---|---|---|---|
| Standard | 1.95 | 1.98 | 2.01 | 2.04 | 2.07 | 2.10 | 2.13 |
| Camarilla | 2.03 | 2.04 | 2.05 | 2.05 | 2.06 | 2.06 | 2.07 |
| Woodie | 1.96 | 1.98 | 2.02 | 2.04 | 2.08 | 2.10 | 2.14 |
| Fibonacci | 1.98 | 2.00 | 2.01 | 2.04 | 2.06 | 2.07 | 2.10 |
| Pivot points | S3 | S2 | S1 | PP | R1 | R2 | R3 |
|---|---|---|---|---|---|---|---|
| Standard | 1.86 | 1.93 | 1.99 | 2.06 | 2.12 | 2.19 | 2.25 |
| Camarilla | 2.01 | 2.03 | 2.04 | 2.05 | 2.06 | 2.07 | 2.09 |
| Woodie | 1.86 | 1.93 | 1.99 | 2.06 | 2.12 | 2.19 | 2.25 |
| Fibonacci | 1.93 | 1.98 | 2.01 | 2.06 | 2.11 | 2.14 | 2.19 |
| Pivot points | S3 | S2 | S1 | PP | R1 | R2 | R3 |
|---|---|---|---|---|---|---|---|
| Standard | -0.19 | 0.76 | 1.48 | 2.43 | 3.15 | 4.10 | 4.82 |
| Camarilla | 1.74 | 1.89 | 2.05 | 2.20 | 2.35 | 2.51 | 2.66 |
| Woodie | -0.31 | 0.70 | 1.37 | 2.37 | 3.04 | 4.04 | 4.71 |
| Fibonacci | 0.76 | 1.40 | 1.79 | 2.43 | 3.07 | 3.46 | 4.10 |
Numerical data
The following is the status of technical indicators and moving averages registered at the time this technical analysis was created:
| RSI (14): | 41.88 | |
| MACD (12,26,9): | -0.0100 | |
| Directional Movement: | 9.23 | |
| AROON (14): | -100.00 | |
| DEMA (21): | 2.08 | |
| Parabolic SAR (0,02-0,02-0,2): | 2.76 | |
| Elder Ray (13): | -0.08 | |
| Super Trend (3,10): | 2.21 | |
| Zig ZAG (10): | 2.01 | |
| VORTEX (21): | 0.8000 | |
| Stochastique (14,3,5): | 22.92 | |
| TEMA (21): | 2.05 | |
| Williams %R (14): | -73.91 | |
| Chande Momentum Oscillator (20): | -0.10 | |
| Repulse (5,40,3): | 1.0600 | |
| ROCnROLL: | 2 | |
| TRIX (15,9): | 0.1000 | |
| Courbe Coppock: | 13.76 |
| MA7: | 2.05 | |
| MA20: | 2.12 | |
| MA50: | 2.02 | |
| MA100: | 2.20 | |
| MAexp7: | 2.05 | |
| MAexp20: | 2.08 | |
| MAexp50: | 2.11 | |
| MAexp100: | 2.34 | |
| Price / MA7: | -1.95% | |
| Price / MA20: | -5.19% | |
| Price / MA50: | -0.50% | |
| Price / MA100: | -8.64% | |
| Price / MAexp7: | -1.95% | |
| Price / MAexp20: | -3.37% | |
| Price / MAexp50: | -4.74% | |
| Price / MAexp100: | -14.10% |
About author

Online


Add a comment
Comments
0 comments on the analysis DARWINIA COMMITMENT TOKEN - KTON/USDT - Daily