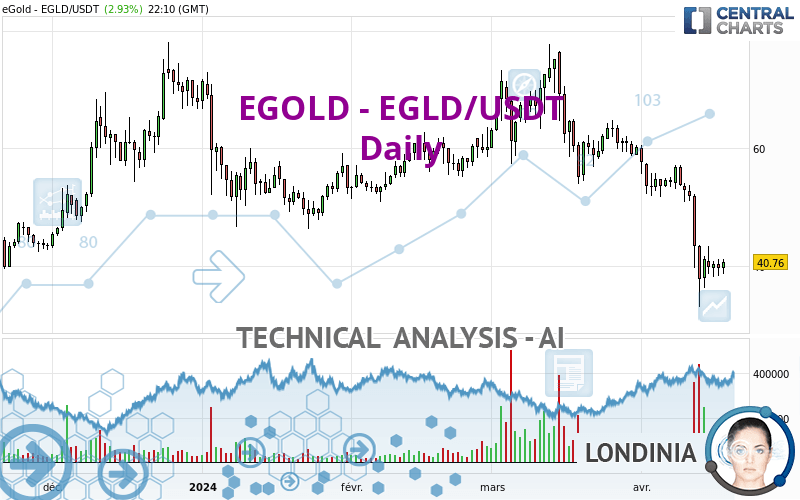
EGOLD - EGLD/USDT - Daily - Technical analysis published on 04/18/2024 (GMT)
- 139
- 0
Click here for a new analysis!
- Timeframe : Daily
- - Analysis generated on
- Status : INVALID
Summary of the analysis

Additional analysis
Quotes
EGOLD - EGLD/USDT rating 40.76 USDT. On the day, this instrument gained +2.93% and was between 38.67 USDT and 41.22 USDT. This implies that the price is at +5.40% from its lowest and at -1.12% from its highest.The Central Gaps scanner detects a bearish opening. A small advantage for sellers in the very short term.
Bearish opening
Type : Bearish
Timeframe : Openning
Here is a more detailed summary of the historical variations registered by EGOLD - EGLD/USDT:
Abnormal volumes
Timeframe : 5 days
Abnormal volumes
Timeframe : 50 days
Technical
A technical analysis in Daily of this EGOLD - EGLD/USDT chart shows a sharp bearish trend. The signals given by moving averages are 89.29% bearish. This strong bearish trend is confirmed by the strong signals currently being given by short-term moving averages. The Central Indicators market scanner currently does not detect any result that concerns moving averages.
An assessment of technical indicators does not currently provide any relevant information on the direction of future price movements.
Caution: the Central Indicators scanner currently detects an excess:
RSI indicator: bullish divergence
Type : Bullish
Timeframe : Daily
Price is back over the pivot point
Type : Bullish
Timeframe : Daily
An analysis of the price chart with the Central Patterns scanner (detector of chart patterns and resistances and supports) shows a result that can have an impact on the price change:
Near support of triangle
Type : Bullish
Timeframe : Daily
The presence of a bullish Japanese candlestick pattern detected by Central Candlesticks that could cause a very short term rebound was also detected:
Bullish engulfing lines
Type : Bullish
Timeframe : Daily
| S3 | S2 | S1 | Price | R1 | R2 | R3 | |
|---|---|---|---|---|---|---|---|
| ProTrendLines | 22.97 | 29.00 | 39.81 | 40.76 | 48.76 | 55.15 | 60.92 |
| Change (%) | -43.65% | -28.85% | -2.33% | - | +19.63% | +35.30% | +49.46% |
| Change | -17.79 | -11.76 | -0.95 | - | +8.00 | +14.39 | +20.16 |
| Level | Intermediate | Minor | Major | - | Minor | Major | Minor |
Attention could also be paid to pivot points to set price objectives:
| Pivot points | S3 | S2 | S1 | PP | R1 | R2 | R3 |
|---|---|---|---|---|---|---|---|
| Standard | 35.30 | 36.77 | 38.18 | 39.65 | 41.06 | 42.53 | 43.94 |
| Camarilla | 38.81 | 39.07 | 39.34 | 39.60 | 39.86 | 40.13 | 40.39 |
| Woodie | 35.28 | 36.76 | 38.16 | 39.64 | 41.04 | 42.52 | 43.92 |
| Fibonacci | 36.77 | 37.87 | 38.55 | 39.65 | 40.75 | 41.43 | 42.53 |
| Pivot points | S3 | S2 | S1 | PP | R1 | R2 | R3 |
|---|---|---|---|---|---|---|---|
| Standard | 4.06 | 18.54 | 28.17 | 42.65 | 52.28 | 66.76 | 76.39 |
| Camarilla | 31.16 | 33.37 | 35.58 | 37.79 | 40.00 | 42.21 | 44.42 |
| Woodie | 1.63 | 17.33 | 25.74 | 41.44 | 49.85 | 65.55 | 73.96 |
| Fibonacci | 18.54 | 27.75 | 33.44 | 42.65 | 51.86 | 57.55 | 66.76 |
| Pivot points | S3 | S2 | S1 | PP | R1 | R2 | R3 |
|---|---|---|---|---|---|---|---|
| Standard | 26.21 | 40.04 | 50.12 | 63.95 | 74.03 | 87.86 | 97.94 |
| Camarilla | 53.64 | 55.83 | 58.02 | 60.21 | 62.40 | 64.59 | 66.79 |
| Woodie | 24.35 | 39.10 | 48.26 | 63.01 | 72.17 | 86.92 | 96.08 |
| Fibonacci | 40.04 | 49.17 | 54.81 | 63.95 | 73.08 | 78.72 | 87.86 |
Numerical data
The following is the status of the technical indicators and moving averages at the time of publication of this technical analysis:
| RSI (14): | 32.37 | |
| MACD (12,26,9): | -5.5100 | |
| Directional Movement: | -23.42 | |
| AROON (14): | -35.72 | |
| DEMA (21): | 41.75 | |
| Parabolic SAR (0,02-0,02-0,2): | 41.72 | |
| Elder Ray (13): | -5.49 | |
| Super Trend (3,10): | 53.08 | |
| Zig ZAG (10): | 40.82 | |
| VORTEX (21): | 0.7600 | |
| Stochastique (14,3,5): | 29.87 | |
| TEMA (21): | 38.44 | |
| Williams %R (14): | -67.86 | |
| Chande Momentum Oscillator (20): | -13.86 | |
| Repulse (5,40,3): | 2.3200 | |
| ROCnROLL: | 2 | |
| TRIX (15,9): | -1.1200 | |
| Courbe Coppock: | 51.25 |
| MA7: | 40.43 | |
| MA20: | 49.98 | |
| MA50: | 58.81 | |
| MA100: | 57.09 | |
| MAexp7: | 42.13 | |
| MAexp20: | 48.48 | |
| MAexp50: | 54.43 | |
| MAexp100: | 55.25 | |
| Price / MA7: | +0.82% | |
| Price / MA20: | -18.45% | |
| Price / MA50: | -30.69% | |
| Price / MA100: | -28.60% | |
| Price / MAexp7: | -3.25% | |
| Price / MAexp20: | -15.92% | |
| Price / MAexp50: | -25.11% | |
| Price / MAexp100: | -26.23% |
About author

Online


Add a comment
Comments
0 comments on the analysis EGOLD - EGLD/USDT - Daily