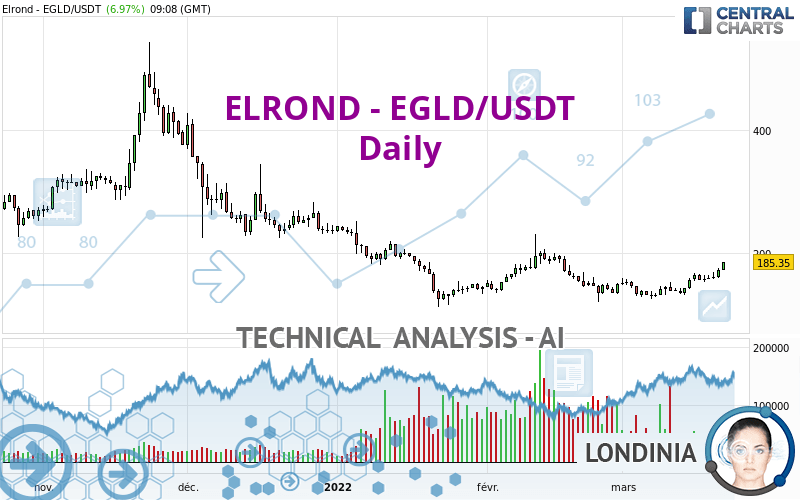
EGOLD - EGLD/USDT - Daily - Technical analysis published on 03/22/2022 (GMT)
- 196
- 0
Click here for a new analysis!
- Timeframe : Daily
- - Analysis generated on
- Status : INVALID

Summary of the analysis

Additional analysis
Quotes
ELROND - EGLD/USDT rating 185.35 USDT. On the day, this instrument gained +6.97% and was traded between 172.20 USDT and 185.77 USDT over the period. The price is currently at +7.64% from its lowest and -0.23% from its highest.A bearish opening was detected by the Central Gaps scanner. Sellers are trying to impose a bearish trend in the very short term.
Bearish opening
Type : Bearish
Timeframe : Openning
So that you have an overall view of the price change, here is a table showing the variations over several periods:
New HIGH record (1 month)
Type : Bullish
Timeframe : Weekly
Abnormal volumes on ELROND - EGLD/USDT were detected by the Central Volumes scanner:
Abnormal volumes
Timeframe : 50 days
Technical
Technical analysis of ELROND - EGLD/USDT in Daily shows an overall slightly bullish trend. 60.71% of the signals given by moving averages are bullish. This slightly bullish trend could be reinforced by the strong bullish signals given by short-term moving averages. The Central Indicators market scanner is currently detecting several bullish signals that could impact this trend:
Bullish price crossover with Moving Average 100
Type : Bullish
Timeframe : Daily
Bullish price crossover with adaptative moving average 100
Type : Bullish
Timeframe : Daily
The probability of a further increase is high given the direction of the technical indicators.
But beware of excesses. The Central Indicators scanner currently detects this:
CCI indicator is overbought : over 100
Type : Neutral
Timeframe : Daily
Williams %R indicator is overbought : over -20
Type : Neutral
Timeframe : Daily
Pivot points : price is over resistance 1
Type : Neutral
Timeframe : Daily
Pivot points : price is over resistance 1
Type : Neutral
Timeframe : Weekly
Ichimoku : price is over the cloud
Type : Bullish
Timeframe : Daily
Central Patterns, the scanner specializing in chart patterns, did not identify any signals.
The Central Candlesticks scanner, specialised in Japanese candlesticks, did not identify any signals.
| S1 | Price | R1 | R2 | R3 | |
|---|---|---|---|---|---|
| ProTrendLines | 128.17 | 185.35 | 200.19 | 231.86 | 295.89 |
| Change (%) | -30.85% | - | +8.01% | +25.09% | +59.64% |
| Change | -57.18 | - | +14.84 | +46.51 | +110.54 |
| Level | Intermediate | - | Minor | Minor | Minor |
Pivot points can also be used to set your price objectives. Here is the price situation in relation to pivot points:
| Pivot points | S3 | S2 | S1 | PP | R1 | R2 | R3 |
|---|---|---|---|---|---|---|---|
| Standard | 147.79 | 153.90 | 163.59 | 169.70 | 179.39 | 185.50 | 195.19 |
| Camarilla | 168.94 | 170.38 | 171.83 | 173.28 | 174.73 | 176.18 | 177.63 |
| Woodie | 149.58 | 154.80 | 165.38 | 170.60 | 181.18 | 186.40 | 196.98 |
| Fibonacci | 153.90 | 159.94 | 163.66 | 169.70 | 175.74 | 179.46 | 185.50 |
| Pivot points | S3 | S2 | S1 | PP | R1 | R2 | R3 |
|---|---|---|---|---|---|---|---|
| Standard | 104.10 | 118.42 | 139.26 | 153.58 | 174.42 | 188.74 | 209.58 |
| Camarilla | 150.44 | 153.66 | 156.89 | 160.11 | 163.33 | 166.56 | 169.78 |
| Woodie | 107.37 | 120.05 | 142.53 | 155.21 | 177.69 | 190.37 | 212.85 |
| Fibonacci | 118.42 | 131.85 | 140.15 | 153.58 | 167.01 | 175.31 | 188.74 |
| Pivot points | S3 | S2 | S1 | PP | R1 | R2 | R3 |
|---|---|---|---|---|---|---|---|
| Standard | -5.27 | 57.94 | 104.17 | 167.38 | 213.61 | 276.82 | 323.05 |
| Camarilla | 120.31 | 130.35 | 140.38 | 150.41 | 160.44 | 170.47 | 180.51 |
| Woodie | -13.75 | 53.70 | 95.69 | 163.14 | 205.13 | 272.58 | 314.57 |
| Fibonacci | 57.94 | 99.74 | 125.57 | 167.38 | 209.18 | 235.01 | 276.82 |
Numerical data
The following is the status of the technical indicators and moving averages at the time of publication of this technical analysis:
| RSI (14): | 67.64 | |
| MACD (12,26,9): | 4.9700 | |
| Directional Movement: | 15.36 | |
| AROON (14): | 100.00 | |
| DEMA (21): | 159.90 | |
| Parabolic SAR (0,02-0,02-0,2): | 146.75 | |
| Elder Ray (13): | 19.39 | |
| Super Trend (3,10): | 142.35 | |
| Zig ZAG (10): | 184.72 | |
| VORTEX (21): | 1.1000 | |
| Stochastique (14,3,5): | 91.10 | |
| TEMA (21): | 169.17 | |
| Williams %R (14): | -0.43 | |
| Chande Momentum Oscillator (20): | 40.62 | |
| Repulse (5,40,3): | 14.2600 | |
| ROCnROLL: | 1 | |
| TRIX (15,9): | -0.0200 | |
| Courbe Coppock: | 40.90 |
| MA7: | 165.63 | |
| MA20: | 148.57 | |
| MA50: | 157.16 | |
| MA100: | 182.24 | |
| MAexp7: | 166.75 | |
| MAexp20: | 156.00 | |
| MAexp50: | 161.06 | |
| MAexp100: | 180.79 | |
| Price / MA7: | +11.91% | |
| Price / MA20: | +24.76% | |
| Price / MA50: | +17.94% | |
| Price / MA100: | +1.71% | |
| Price / MAexp7: | +11.15% | |
| Price / MAexp20: | +18.81% | |
| Price / MAexp50: | +15.08% | |
| Price / MAexp100: | +2.52% |
About author

Online


Add a comment
Comments
0 comments on the analysis EGOLD - EGLD/USDT - Daily