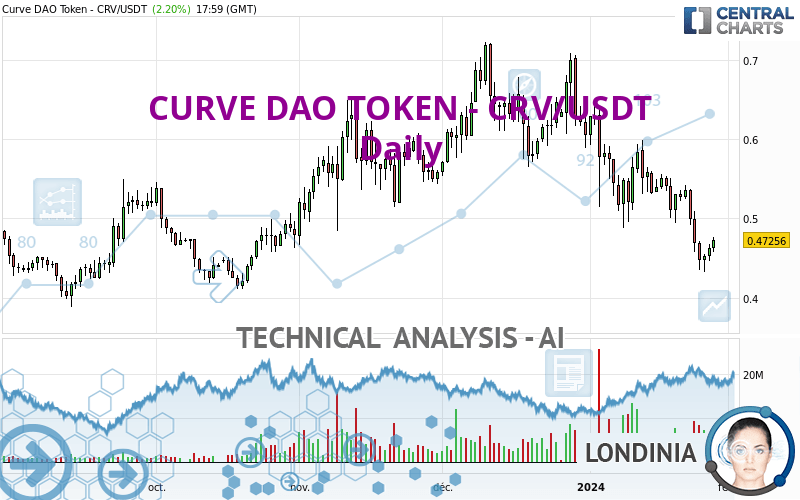
CURVE DAO TOKEN - CRV/USDT - Daily - Technical analysis published on 01/27/2024 (GMT)
- 159
- 0
Click here for a new analysis!
- Timeframe : Daily
- - Analysis generated on
- Status : INVALID

Summary of the analysis

Additional analysis
Quotes
The CURVE DAO TOKEN - CRV/USDT price is 0.472560 USDT. The price has increased by +2.21% since the last closing and was traded between 0.457526 USDT and 0.476859 USDT over the period. The price is currently at +3.29% from its lowest and -0.90% from its highest.So that you have an overall view of the price change, here is a table showing the variations over several periods:
Abnormal volumes
Timeframe : 5 days
Abnormal volumes
Timeframe : 20 days
Abnormal volumes
Timeframe : 50 days
Technical
Technical analysis of this Daily chart of CURVE DAO TOKEN - CRV/USDT indicates that the overall trend is bearish. The signals given by moving averages are 78.57% bearish. This bearish trend is reinforced by the strong signals currently being given by short-term moving averages. There is no crossing of moving average by the price or crossing of moving averages between themselves.
The technical indicators are generally neutral. They do not provide relevant information on the direction of future price movements.
But beware of excesses. The Central Indicators scanner currently detects this:
CCI indicator is oversold : under -100
Type : Neutral
Timeframe : Daily
Pivot points : price is over resistance 1
Type : Neutral
Timeframe : Daily
Pivot points : price is under support 1
Type : Neutral
Timeframe : Weekly
The Central Patterns scanner, which studies chart patterns, resistances and supports, has identified this signal:
Horizontal resistance is broken
Type : Bullish
Timeframe : Daily
The Central Candlesticks scanner which studies Japanese candlesticks did not detect anything.
| S2 | S1 | Price | R1 | R2 | R3 | |
|---|---|---|---|---|---|---|
| ProTrendLines | 0.414207 | 0.450208 | 0.472560 | 0.505552 | 0.630635 | 0.719734 |
| Change (%) | -12.35% | -4.73% | - | +6.98% | +33.45% | +52.31% |
| Change | -0.058353 | -0.022352 | - | +0.032992 | +0.158075 | +0.247174 |
| Level | Intermediate | Intermediate | - | Major | Intermediate | Intermediate |
To determine price objectives, it is also possible to use the pivot points. Here is the price position in relation to pivot points:
| Pivot points | S3 | S2 | S1 | PP | R1 | R2 | R3 |
|---|---|---|---|---|---|---|---|
| Standard | 0.429140 | 0.437789 | 0.450077 | 0.458726 | 0.471014 | 0.479663 | 0.491951 |
| Camarilla | 0.456607 | 0.458527 | 0.460446 | 0.462365 | 0.464284 | 0.466204 | 0.468123 |
| Woodie | 0.430960 | 0.438699 | 0.451897 | 0.459636 | 0.472834 | 0.480573 | 0.493771 |
| Fibonacci | 0.437789 | 0.445787 | 0.450728 | 0.458726 | 0.466724 | 0.471665 | 0.479663 |
| Pivot points | S3 | S2 | S1 | PP | R1 | R2 | R3 |
|---|---|---|---|---|---|---|---|
| Standard | 0.429939 | 0.462323 | 0.495029 | 0.527413 | 0.560119 | 0.592503 | 0.625209 |
| Camarilla | 0.509835 | 0.515802 | 0.521768 | 0.527735 | 0.533702 | 0.539668 | 0.545635 |
| Woodie | 0.430100 | 0.462404 | 0.495190 | 0.527494 | 0.560280 | 0.592584 | 0.625370 |
| Fibonacci | 0.462323 | 0.487187 | 0.502549 | 0.527413 | 0.552277 | 0.567639 | 0.592503 |
| Pivot points | S3 | S2 | S1 | PP | R1 | R2 | R3 |
|---|---|---|---|---|---|---|---|
| Standard | 0.381384 | 0.473345 | 0.539333 | 0.631294 | 0.697282 | 0.789243 | 0.855231 |
| Camarilla | 0.561886 | 0.576365 | 0.590843 | 0.605322 | 0.619801 | 0.634279 | 0.648758 |
| Woodie | 0.368399 | 0.466852 | 0.526348 | 0.624801 | 0.684297 | 0.782750 | 0.842246 |
| Fibonacci | 0.473345 | 0.533681 | 0.570957 | 0.631294 | 0.691630 | 0.728906 | 0.789243 |
Numerical data
The following are the details of the technical indicators and moving averages that were collected to generate this technical analysis:
| RSI (14): | 38.46 | |
| MACD (12,26,9): | -0.0329 | |
| Directional Movement: | -16.790234 | |
| AROON (14): | -85.714286 | |
| DEMA (21): | 0.473305 | |
| Parabolic SAR (0,02-0,02-0,2): | 0.501114 | |
| Elder Ray (13): | -0.029442 | |
| Super Trend (3,10): | 0.553705 | |
| Zig ZAG (10): | 0.472148 | |
| VORTEX (21): | 0.9059 | |
| Stochastique (14,3,5): | 22.10 | |
| TEMA (21): | 0.456552 | |
| Williams %R (14): | -68.41 | |
| Chande Momentum Oscillator (20): | -0.067310 | |
| Repulse (5,40,3): | 2.3713 | |
| ROCnROLL: | 2 | |
| TRIX (15,9): | -0.7181 | |
| Courbe Coppock: | 26.72 |
| MA7: | 0.477311 | |
| MA20: | 0.520150 | |
| MA50: | 0.582180 | |
| MA100: | 0.567690 | |
| MAexp7: | 0.477911 | |
| MAexp20: | 0.514581 | |
| MAexp50: | 0.551430 | |
| MAexp100: | 0.562366 | |
| Price / MA7: | -1.00% | |
| Price / MA20: | -9.15% | |
| Price / MA50: | -18.83% | |
| Price / MA100: | -16.76% | |
| Price / MAexp7: | -1.12% | |
| Price / MAexp20: | -8.17% | |
| Price / MAexp50: | -14.30% | |
| Price / MAexp100: | -15.97% |
About author

Online


Add a comment
Comments
0 comments on the analysis CURVE DAO TOKEN - CRV/USDT - Daily