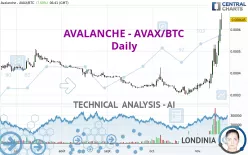
AVALANCHE - AVAX/BTC - Daily - Technical analysis published on 11/17/2023 (GMT)
- 142
- 0
Click here for a new analysis!
- Timeframe : Daily
- - Analysis generated on
- Status : INVALID
Summary of the analysis

Additional analysis
Quotes
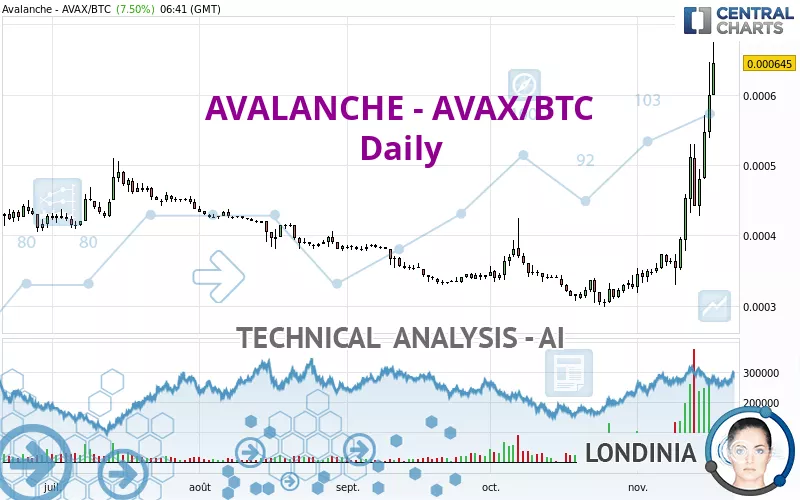
The AVALANCHE - AVAX/BTC rating is 0.000645 BTC. On the day, this instrument gained +7.50% with the lowest point at 0.000600 BTC and the highest point at 0.000675 BTC. The deviation from the price is +7.50% for the low point and -4.44% for the high point.Here is a more detailed summary of the historical variations registered by AVALANCHE - AVAX/BTC:
New HIGH record (1st january)
Type : Bullish
Timeframe : Weekly
New HIGH record (1 month)
Type : Bullish
Timeframe : Weekly
Abnormal volumes on AVALANCHE - AVAX/BTC were detected by the Central Volumes scanner:
Abnormal volumes
Timeframe : 5 days
Abnormal volumes
Timeframe : 20 days
Abnormal volumes
Timeframe : 50 days
Technical
A technical analysis in Daily of this AVALANCHE - AVAX/BTC chart shows a strongly bullish trend. 89.29% of the signals given by moving averages are bullish. The overall trend is supported by the strong bullish signals from short-term moving averages. There is no crossing of moving average by the price or crossing of moving averages between themselves.
An assessment of technical indicators shows a strong bullish signal.
Caution: the Central Indicators scanner currently detects an excess:
RSI indicator is overbought : over 80
Type : Neutral
Timeframe : Daily
CCI indicator is overbought : over 100
Type : Neutral
Timeframe : Daily
CCI indicator: bearish divergence
Type : Bearish
Timeframe : Daily
Williams %R indicator is overbought : over -20
Type : Neutral
Timeframe : Daily
Pivot points : price is over resistance 3
Type : Neutral
Timeframe : Weekly
The Central Patterns scanner, which studies chart patterns, resistances and supports, has identified this signal:
Resistance of channel is broken
Type : Bullish
Timeframe : Daily
No result was found by the Central Candlesticks scanner on Japanese candlesticks.
| S3 | S2 | S1 | Price | R1 | R2 | R3 | |
|---|---|---|---|---|---|---|---|
| ProTrendLines | 0.000490 | 0.000545 | 0.000593 | 0.000645 | 0.000923 | 0.001704 | 0.002180 |
| Change (%) | -24.03% | -15.50% | -8.06% | - | +43.10% | +164.19% | +237.98% |
| Change | -0.000155 | -0.000100 | -0.000052 | - | +0.000278 | +0.001059 | +0.001535 |
| Level | Intermediate | Intermediate | Major | - | Intermediate | Minor | Minor |
Attention could also be paid to pivot points to set price objectives:
| Pivot points | S3 | S2 | S1 | PP | R1 | R2 | R3 |
|---|---|---|---|---|---|---|---|
| Standard | 0.000435 | 0.000487 | 0.000543 | 0.000595 | 0.000651 | 0.000703 | 0.000759 |
| Camarilla | 0.000570 | 0.000580 | 0.000590 | 0.000600 | 0.000610 | 0.000620 | 0.000630 |
| Woodie | 0.000438 | 0.000488 | 0.000546 | 0.000596 | 0.000654 | 0.000704 | 0.000762 |
| Fibonacci | 0.000487 | 0.000528 | 0.000553 | 0.000595 | 0.000636 | 0.000661 | 0.000703 |
| Pivot points | S3 | S2 | S1 | PP | R1 | R2 | R3 |
|---|---|---|---|---|---|---|---|
| Standard | 0.000240 | 0.000285 | 0.000369 | 0.000414 | 0.000498 | 0.000543 | 0.000627 |
| Camarilla | 0.000418 | 0.000429 | 0.000441 | 0.000453 | 0.000465 | 0.000477 | 0.000489 |
| Woodie | 0.000260 | 0.000295 | 0.000389 | 0.000424 | 0.000518 | 0.000553 | 0.000647 |
| Fibonacci | 0.000285 | 0.000334 | 0.000365 | 0.000414 | 0.000463 | 0.000494 | 0.000543 |
| Pivot points | S3 | S2 | S1 | PP | R1 | R2 | R3 |
|---|---|---|---|---|---|---|---|
| Standard | 0.000149 | 0.000224 | 0.000275 | 0.000350 | 0.000401 | 0.000476 | 0.000527 |
| Camarilla | 0.000292 | 0.000304 | 0.000316 | 0.000327 | 0.000339 | 0.000350 | 0.000362 |
| Woodie | 0.000138 | 0.000218 | 0.000264 | 0.000344 | 0.000390 | 0.000470 | 0.000516 |
| Fibonacci | 0.000224 | 0.000272 | 0.000302 | 0.000350 | 0.000398 | 0.000428 | 0.000476 |
Numerical data
The following are the details of the technical indicators and moving averages that were collected to generate this technical analysis:
| RSI (14): | 80.05 | |
| MACD (12,26,9): | 0.0001 | |
| Directional Movement: | 39.173192 | |
| AROON (14): | 57.142857 | |
| DEMA (21): | 0.000514 | |
| Parabolic SAR (0,02-0,02-0,2): | 0.000411 | |
| Elder Ray (13): | 0.000157 | |
| Super Trend (3,10): | 0.000470 | |
| Zig ZAG (10): | 0.000651 | |
| VORTEX (21): | 1.3208 | |
| Stochastique (14,3,5): | 89.51 | |
| TEMA (21): | 0.000566 | |
| Williams %R (14): | -6.96 | |
| Chande Momentum Oscillator (20): | 0.000297 | |
| Repulse (5,40,3): | 21.8032 | |
| ROCnROLL: | 1 | |
| TRIX (15,9): | 1.3990 | |
| Courbe Coppock: | 106.48 |
| MA7: | 0.000526 | |
| MA20: | 0.000413 | |
| MA50: | 0.000367 | |
| MA100: | 0.000372 | |
| MAexp7: | 0.000537 | |
| MAexp20: | 0.000445 | |
| MAexp50: | 0.000393 | |
| MAexp100: | 0.000392 | |
| Price / MA7: | +22.62% | |
| Price / MA20: | +56.17% | |
| Price / MA50: | +75.75% | |
| Price / MA100: | +73.39% | |
| Price / MAexp7: | +20.11% | |
| Price / MAexp20: | +44.94% | |
| Price / MAexp50: | +64.12% | |
| Price / MAexp100: | +64.54% |
About author

Online


Add a comment
Comments
0 comments on the analysis AVALANCHE - AVAX/BTC - Daily