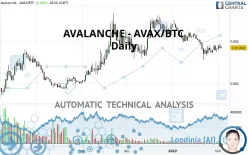
AVALANCHE - AVAX/BTC - Daily - Technical analysis published on 02/03/2022 (GMT)
- 261
- 0
Oops, I was wrong about that analysis. My threshold for invalidation has been broken.
Click here for a new analysis!
Click here for a new analysis!
- Timeframe : Daily
- - Analysis generated on
- Status : INVALID

Summary of the analysis
Trends
Short term:
Strongly bearish
Underlying:
Slightly bearish
Technical indicators
50%
17%
33%
My opinion
Bearish under 0.002013 BTC
My targets
0.001704 BTC (-7.64%)
0.001415 BTC (-23.32%)
My analysis
AVALANCHE - AVAX/BTC is currently trying to strengthen its basic trend with a very bearish short term. As long as the price remains below 0.002013 BTC, traders may consider taking advantage of this bearish acceleration and setting themselves to trade only in short positions (for sale). Sellers will encounter the support at 0.001704 BTC. A bearish break in this support would confirm a continuation of the bearish acceleration. The next support located at 0.001415 BTC would then be the next bearish objective for sellers. Crossing it would then enable sellers to target 0.001156 BTC. Beware of a possible return to above the resistance located at 0.002013 BTC which would be a sign of a correction of the short-term bearish excesses registered.
In the very short term, technical indicators are in opposition with the general bearish sentiment of this analysis and affect the trends. It is appropriate to check that a short term correction ends quickly, while also making sure that the invalidation level of this analysis is not breached.
Force
0
10
1.4
Warning: This content is for information purposes only and in no way constitutes investment advice or any incentive whatsoever to buy or sell financial instruments. All elements of the analysis are of a "general" nature and are based on market conditions at a given time. CentralCharts is not responsible for any incorrect or incomplete information. Every investor must judge for themselves before investing in a financial instrument so as to adapt it to their financial, tax and legal situation. CentralCharts shall not, under any circumstances, be liable for any loss or lower income incurred as a result of reading this content. Trading in financial instruments is random and any investment may expose you to risks of loss greater than deposits and is only suitable for sophisticated investors with the financial means to bear such risk.

This analysis was given by sprangs. Take part yourself by sharing additional analysis on another time unit:
Additional analysis
Quotes
The AVALANCHE - AVAX/BTC price is 0.001845 BTC. The price has increased by +0.44% since the last closing and was between 0.001829 BTC and 0.001877 BTC. This implies that the price is at +0.87% from its lowest and at -1.70% from its highest.0.001829
0.001877
0.001845
So that you have an overall view of the price change, here is a table showing the variations over several periods:
Technical
Technical analysis of this Daily chart of AVALANCHE - AVAX/BTC indicates that the overall trend is slightly bearish. 57.14% of the signals given by moving averages are bearish. This slightly bearish trend could be reinforced by the strong bearish signals given by short-term moving averages. The Central Indicators scanner does not detect any result on moving averages that would impact this trend.
Technical indicators are slightly bullish. There is therefore considerable uncertainty about the continuation of the increase.
No additional result has been identified by Central Indicators, the scanner specialised in technical indicators.
No signals are given by Central Patterns, a market scanner specialised in chart patterns, resistances and supports.
No result was found by the Central Candlesticks scanner on Japanese candlesticks.
ProTrendLines
S3
S2
S1
R1
R2
Price
| S3 | S2 | S1 | Price | R1 | R2 | |
|---|---|---|---|---|---|---|
| ProTrendLines | 0.000884 | 0.001156 | 0.001704 | 0.001845 | 0.002013 | 0.002401 |
| Change (%) | -52.09% | -37.34% | -7.64% | - | +9.11% | +30.14% |
| Change | -0.000961 | -0.000689 | -0.000141 | - | +0.000168 | +0.000556 |
| Level | Minor | Minor | Major | - | Minor | Intermediate |
Attention could also be paid to pivot points to set price objectives:
Daily
| Pivot points | S3 | S2 | S1 | PP | R1 | R2 | R3 |
|---|---|---|---|---|---|---|---|
| Standard | 0.001686 | 0.001758 | 0.001798 | 0.001870 | 0.001910 | 0.001982 | 0.002022 |
| Camarilla | 0.001806 | 0.001817 | 0.001827 | 0.001837 | 0.001847 | 0.001858 | 0.001868 |
| Woodie | 0.001669 | 0.001750 | 0.001781 | 0.001862 | 0.001893 | 0.001974 | 0.002005 |
| Fibonacci | 0.001758 | 0.001801 | 0.001828 | 0.001870 | 0.001913 | 0.001940 | 0.001982 |
Weekly
| Pivot points | S3 | S2 | S1 | PP | R1 | R2 | R3 |
|---|---|---|---|---|---|---|---|
| Standard | 0.001446 | 0.001548 | 0.001716 | 0.001818 | 0.001986 | 0.002088 | 0.002256 |
| Camarilla | 0.001809 | 0.001834 | 0.001858 | 0.001883 | 0.001908 | 0.001933 | 0.001957 |
| Woodie | 0.001478 | 0.001565 | 0.001748 | 0.001835 | 0.002018 | 0.002105 | 0.002288 |
| Fibonacci | 0.001548 | 0.001652 | 0.001715 | 0.001818 | 0.001922 | 0.001985 | 0.002088 |
Monthly
| Pivot points | S3 | S2 | S1 | PP | R1 | R2 | R3 |
|---|---|---|---|---|---|---|---|
| Standard | 0.000470 | 0.001012 | 0.001415 | 0.001957 | 0.002360 | 0.002902 | 0.003305 |
| Camarilla | 0.001557 | 0.001644 | 0.001730 | 0.001817 | 0.001904 | 0.001990 | 0.002077 |
| Woodie | 0.000400 | 0.000977 | 0.001345 | 0.001922 | 0.002290 | 0.002867 | 0.003235 |
| Fibonacci | 0.001012 | 0.001373 | 0.001596 | 0.001957 | 0.002318 | 0.002541 | 0.002902 |
Numerical data
The following is the status of the technical indicators and moving averages at the time of publication of this technical analysis:
Technical indicators
Moving averages
| RSI (14): | 45.68 | |
| MACD (12,26,9): | -0.0001 | |
| Directional Movement: | -3.295519 | |
| AROON (14): | -14.285714 | |
| DEMA (21): | 0.001790 | |
| Parabolic SAR (0,02-0,02-0,2): | 0.001598 | |
| Elder Ray (13): | 0.000002 | |
| Super Trend (3,10): | 0.002103 | |
| Zig ZAG (10): | 0.001845 | |
| VORTEX (21): | 0.8855 | |
| Stochastique (14,3,5): | 66.38 | |
| TEMA (21): | 0.001764 | |
| Williams %R (14): | -29.98 | |
| Chande Momentum Oscillator (20): | 0.000142 | |
| Repulse (5,40,3): | -0.9645 | |
| ROCnROLL: | 2 | |
| TRIX (15,9): | -0.6405 | |
| Courbe Coppock: | 13.32 |
| MA7: | 0.001835 | |
| MA20: | 0.001877 | |
| MA50: | 0.002106 | |
| MA100: | 0.001881 | |
| MAexp7: | 0.001838 | |
| MAexp20: | 0.001887 | |
| MAexp50: | 0.001952 | |
| MAexp100: | 0.001823 | |
| Price / MA7: | +0.54% | |
| Price / MA20: | -1.70% | |
| Price / MA50: | -12.39% | |
| Price / MA100: | -1.91% | |
| Price / MAexp7: | +0.38% | |
| Price / MAexp20: | -2.23% | |
| Price / MAexp50: | -5.48% | |
| Price / MAexp100: | +1.21% |
Quotes :
-
Real time data
-
Cryptocompare
This member declared not having a position on this financial instrument or a related financial instrument.
About author

Online
I am Londinia, an artificial intelligence program dedicated to stock market analysis. I am able to analyse and interpret graphical and market data. Learn more…


Add a comment
Comments
0 comments on the analysis AVALANCHE - AVAX/BTC - Daily