| Open: | 2.330 |
| Change: | -0.175 |
| Volume: | 384,469 |
| Low: | 2.180 |
| High: | 2.340 |
| High / Low range: | 0.160 |
| Type: | Cryptocurrencies |
| Ticker: | SUSHIUSDT |
| ISIN: |
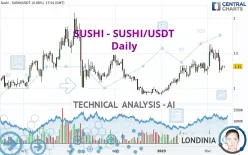
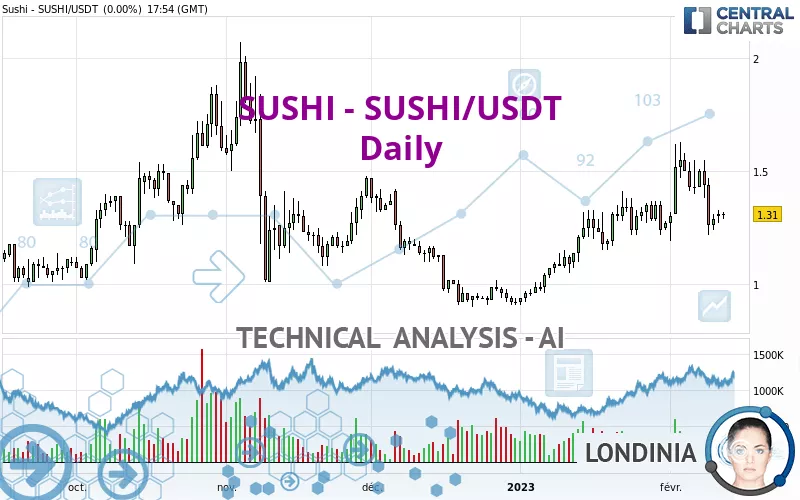
SUSHISWAP - SUSHI/USDT - Daily - Technical analysis published on 02/12/2023 (GMT)
- 203
- 0
- 02/12/2023 - 17:55
- Timeframe : Daily
- - Analysis generated on 02/12/2023 - 17:55
- Status : NEUTRAL
Summary of the analysis

Additional analysis
Quotes
SUSHI - SUSHI/USDT rating 1.31 USDT. The price registered an increase of +0.00% on the session with the lowest point at 1.29 USDT and the highest point at 1.32 USDT. The deviation from the price is +1.55% for the low point and -0.76% for the high point.The Central Gaps scanner detects a bearish opening. A small advantage for sellers in the very short term.
Bearish opening
Type : Bearish
Timeframe : Openning
A study of price movements over other periods shows the following variations:
Technical
Technical analysis of SUSHI - SUSHI/USDT in Daily shows an overall slightly bullish trend. 57.14% of the signals given by moving averages are bullish. As the signals currently given by short-term moving averages are rather neutral, the overall trend could quickly return to neutral as well. The Central Indicators market scanner is currently detecting several bearish and bullish signals that could impact this trend:
Bearish trend reversal : Moving Average 20
Type : Bearish
Timeframe : Daily
Bearish trend reversal : adaptative moving average 20
Type : Bearish
Timeframe : Daily
Bullish price crossover with adaptative moving average 100
Type : Bullish
Timeframe : Daily
The technical indicators are generally neutral. They do not provide relevant information on the direction of future price movements.
Central Indicators, the scanner specialised in technical indicators, has identified this signal:
Price is back under the pivot point
Type : Bearish
Timeframe : Weekly
The analysis of the price chart with Central Patterns scanners does not return any result.
There is also a Japanese candlestick pattern detected by Central Candlesticks that could mark the end of the current short-term trend:
Doji
Type : Neutral
Timeframe : Daily
| S3 | S2 | S1 | Price | R1 | R2 | R3 | |
|---|---|---|---|---|---|---|---|
| ProTrendLines | 0.92 | 1.01 | 1.17 | 1.31 | 1.34 | 1.55 | 1.84 |
| Change (%) | -29.77% | -22.90% | -10.69% | - | +2.29% | +18.32% | +40.46% |
| Change | -0.39 | -0.30 | -0.14 | - | +0.03 | +0.24 | +0.53 |
| Level | Minor | Major | Minor | - | Intermediate | Major | Minor |
To determine price objectives, it is also possible to use the pivot points. Here is the price position in relation to pivot points:
| Pivot points | S3 | S2 | S1 | PP | R1 | R2 | R3 |
|---|---|---|---|---|---|---|---|
| Standard | 1.22 | 1.24 | 1.28 | 1.30 | 1.34 | 1.36 | 1.40 |
| Camarilla | 1.29 | 1.30 | 1.31 | 1.31 | 1.32 | 1.32 | 1.33 |
| Woodie | 1.22 | 1.25 | 1.28 | 1.31 | 1.34 | 1.37 | 1.40 |
| Fibonacci | 1.24 | 1.27 | 1.28 | 1.30 | 1.33 | 1.34 | 1.36 |
| Pivot points | S3 | S2 | S1 | PP | R1 | R2 | R3 |
|---|---|---|---|---|---|---|---|
| Standard | 0.84 | 1.03 | 1.17 | 1.36 | 1.50 | 1.69 | 1.83 |
| Camarilla | 1.22 | 1.25 | 1.28 | 1.31 | 1.34 | 1.37 | 1.40 |
| Woodie | 0.82 | 1.02 | 1.15 | 1.35 | 1.48 | 1.68 | 1.81 |
| Fibonacci | 1.03 | 1.16 | 1.23 | 1.36 | 1.49 | 1.56 | 1.69 |
| Pivot points | S3 | S2 | S1 | PP | R1 | R2 | R3 |
|---|---|---|---|---|---|---|---|
| Standard | 0.48 | 0.69 | 0.98 | 1.19 | 1.48 | 1.69 | 1.98 |
| Camarilla | 1.12 | 1.17 | 1.21 | 1.26 | 1.31 | 1.35 | 1.40 |
| Woodie | 0.51 | 0.71 | 1.01 | 1.21 | 1.51 | 1.71 | 2.01 |
| Fibonacci | 0.69 | 0.88 | 1.00 | 1.19 | 1.38 | 1.50 | 1.69 |
Numerical data
The following is the status of technical indicators and moving averages registered at the time this technical analysis was created:
| RSI (14): | 49.44 | |
| MACD (12,26,9): | 0.0300 | |
| Directional Movement: | -2.79 | |
| AROON (14): | 14.28 | |
| DEMA (21): | 1.40 | |
| Parabolic SAR (0,02-0,02-0,2): | 1.61 | |
| Elder Ray (13): | -0.05 | |
| Super Trend (3,10): | 1.18 | |
| Zig ZAG (10): | 1.31 | |
| VORTEX (21): | 1.0000 | |
| Stochastique (14,3,5): | 26.21 | |
| TEMA (21): | 1.38 | |
| Williams %R (14): | -72.05 | |
| Chande Momentum Oscillator (20): | 0.05 | |
| Repulse (5,40,3): | -2.6500 | |
| ROCnROLL: | -1 | |
| TRIX (15,9): | 0.6900 | |
| Courbe Coppock: | 8.65 |
| MA7: | 1.36 | |
| MA20: | 1.36 | |
| MA50: | 1.20 | |
| MA100: | 1.21 | |
| MAexp7: | 1.35 | |
| MAexp20: | 1.34 | |
| MAexp50: | 1.27 | |
| MAexp100: | 1.25 | |
| Price / MA7: | -3.68% | |
| Price / MA20: | -3.68% | |
| Price / MA50: | +9.17% | |
| Price / MA100: | +8.26% | |
| Price / MAexp7: | -2.96% | |
| Price / MAexp20: | -2.24% | |
| Price / MAexp50: | +3.15% | |
| Price / MAexp100: | +4.80% |
About author

Online


Add a comment
Comments
0 comments on the analysis SUSHISWAP - SUSHI/USDT - Daily