| Open: | 189.99 |
| Change: | +2.49 |
| Volume: | 268,124 |
| Low: | 185.42 |
| High: | 190.60 |
| High / Low range: | 5.18 |
| Type: | Cryptocurrencies |
| Ticker: | DOTUSD |
| ISIN: |
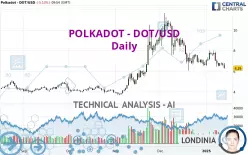
POLKADOT - DOT/USD - Daily - Technical analysis published on 01/13/2025 (GMT)
- 94
- 0
- 01/13/2025 - 09:54
Click here for a new analysis!
- Timeframe : Daily
- - Analysis generated on 01/13/2025 - 09:54
- Status : INVALID

Summary of the analysis

Additional analysis
Quotes
The POLKADOT - DOT/USD rating is 6.29 USD. The price is lower by -5.13% since the last closing with the lowest point at 6.25 USD and the highest point at 6.80 USD. The deviation from the price is +0.64% for the low point and -7.50% for the high point.Here is a more detailed summary of the historical variations registered by POLKADOT - DOT/USD:
New LOW record (1st january)
Type : Bearish
Timeframe : Weekly
Near a new LOW record (1 month)
Type : Bearish
Timeframe : Weekly
Technical
Technical analysis of POLKADOT - DOT/USD in Daily shows an overall bearish trend. The signals given by moving averages are 67.86% bearish. This bearish trend is reinforced by the strong signals currently being given by short-term moving averages. The Central Indicators market scanner is currently detecting several bearish signals that could impact this trend:
Bearish trend reversal : Moving Average 50
Type : Bearish
Timeframe : Daily
Bearish price crossover with Moving Average 100
Type : Bearish
Timeframe : Daily
In fact, 14 technical indicators on 18 studied are currently positioned bearish. But beware of excesses. The Central Indicators scanner currently detects this:
CCI indicator is oversold : under -100
Type : Neutral
Timeframe : Daily
Williams %R indicator is oversold : under -80
Type : Neutral
Timeframe : Daily
Pivot points : price is under support 3
Type : Neutral
Timeframe : Daily
Parabolic SAR indicator bearish reversal
Type : Bearish
Timeframe : Daily
Ichimoku - Bullish crossover : Tenkan & Kijun
Type : Bullish
Timeframe : Daily
No signals are given by Central Patterns, a market scanner specialised in chart patterns, resistances and supports.
The Central Candlesticks scanner, specialised in Japanese candlesticks, did not identify any signals.
| S3 | S2 | S1 | Price | R1 | R2 | R3 | |
|---|---|---|---|---|---|---|---|
| ProTrendLines | 4.88 | 5.55 | 6.28 | 6.29 | 7.53 | 8.40 | 9.52 |
| Change (%) | -22.42% | -11.76% | -0.16% | - | +19.71% | +33.55% | +51.35% |
| Change | -1.41 | -0.74 | -0.01 | - | +1.24 | +2.11 | +3.23 |
| Level | Minor | Intermediate | Major | - | Major | Minor | Minor |
To determine price objectives, it is also possible to use the pivot points. Here is the price position in relation to pivot points:
| Pivot points | S3 | S2 | S1 | PP | R1 | R2 | R3 |
|---|---|---|---|---|---|---|---|
| Standard | 6.24 | 6.39 | 6.51 | 6.66 | 6.78 | 6.93 | 7.05 |
| Camarilla | 6.56 | 6.58 | 6.61 | 6.63 | 6.66 | 6.68 | 6.70 |
| Woodie | 6.23 | 6.38 | 6.50 | 6.65 | 6.77 | 6.92 | 7.04 |
| Fibonacci | 6.39 | 6.49 | 6.56 | 6.66 | 6.76 | 6.83 | 6.93 |
| Pivot points | S3 | S2 | S1 | PP | R1 | R2 | R3 |
|---|---|---|---|---|---|---|---|
| Standard | 4.56 | 5.49 | 6.12 | 7.05 | 7.68 | 8.61 | 9.24 |
| Camarilla | 6.31 | 6.45 | 6.60 | 6.74 | 6.88 | 7.03 | 7.17 |
| Woodie | 4.40 | 5.42 | 5.96 | 6.98 | 7.52 | 8.54 | 9.08 |
| Fibonacci | 5.49 | 6.09 | 6.46 | 7.05 | 7.65 | 8.02 | 8.61 |
| Pivot points | S3 | S2 | S1 | PP | R1 | R2 | R3 |
|---|---|---|---|---|---|---|---|
| Standard | -1.03 | 2.50 | 4.57 | 8.10 | 10.17 | 13.70 | 15.77 |
| Camarilla | 5.09 | 5.60 | 6.12 | 6.63 | 7.14 | 7.66 | 8.17 |
| Woodie | -1.77 | 2.14 | 3.83 | 7.74 | 9.43 | 13.34 | 15.03 |
| Fibonacci | 2.50 | 4.64 | 5.96 | 8.10 | 10.24 | 11.56 | 13.70 |
Numerical data
The following are the details of the technical indicators and moving averages that were collected to generate this technical analysis:
| RSI (14): | 37.38 | |
| MACD (12,26,9): | -0.3000 | |
| Directional Movement: | -10.55 | |
| AROON (14): | -71.43 | |
| DEMA (21): | 6.69 | |
| Parabolic SAR (0,02-0,02-0,2): | 6.30 | |
| Elder Ray (13): | -0.36 | |
| Super Trend (3,10): | 8.06 | |
| Zig ZAG (10): | 6.34 | |
| VORTEX (21): | 0.9600 | |
| Stochastique (14,3,5): | 11.69 | |
| TEMA (21): | 6.47 | |
| Williams %R (14): | -98.82 | |
| Chande Momentum Oscillator (20): | -0.71 | |
| Repulse (5,40,3): | -10.5300 | |
| ROCnROLL: | 2 | |
| TRIX (15,9): | -0.5500 | |
| Courbe Coppock: | 6.52 |
| MA7: | 6.67 | |
| MA20: | 7.02 | |
| MA50: | 8.06 | |
| MA100: | 6.39 | |
| MAexp7: | 6.70 | |
| MAexp20: | 7.07 | |
| MAexp50: | 7.21 | |
| MAexp100: | 6.75 | |
| Price / MA7: | -5.70% | |
| Price / MA20: | -10.40% | |
| Price / MA50: | -21.96% | |
| Price / MA100: | -1.56% | |
| Price / MAexp7: | -6.12% | |
| Price / MAexp20: | -11.03% | |
| Price / MAexp50: | -12.76% | |
| Price / MAexp100: | -6.81% |
About author

Online


Add a comment
Comments
0 comments on the analysis POLKADOT - DOT/USD - Daily