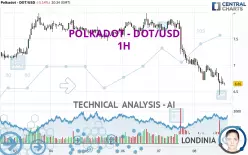
POLKADOT - DOT/USD - 1H - Technical analysis published on 01/08/2025 (GMT)
- 102
- 0
Click here for a new analysis!
- Timeframe : 1H
- - Analysis generated on
- Status : INVALID

Summary of the analysis

Additional analysis
Quotes
The POLKADOT - DOT/USD rating is 6.66 USD. The price is lower by -4.99% since the last closing and was traded between 6.43 USD and 7.13 USD over the period. The price is currently at +3.58% from its lowest and -6.59% from its highest.Here is a more detailed summary of the historical variations registered by POLKADOT - DOT/USD:
New LOW record (1st january)
Type : Bearish
Timeframe : Weekly
The Central Volumes scanner notes the presence of abnormal volumes:
Abnormal volumes
Timeframe : 50 days
Technical
Technical analysis of POLKADOT - DOT/USD in 1H shows a overall strongly bearish trend. The signals given by moving averages are 92.86% bearish. This strong bearish trend is confirmed by the strong signals currently being given by short-term moving averages. The Central Indicators market scanner currently does not detect any result that concerns moving averages.
In fact, Central Analyzer took into account 18 technical indicators and the result was as follows: 5 are bullish, 5 are neutral and 8 are bearish. But beware of excesses. The Central Indicators scanner currently detects this:
CCI indicator is oversold : under -100
Type : Neutral
Timeframe : 1 hour
CCI indicator: bullish divergence
Type : Bullish
Timeframe : 1 hour
MACD indicator: bullish divergence
Type : Bullish
Timeframe : 1 hour
Pivot points : price is under support 1
Type : Neutral
Timeframe : 1 hour
Pivot points : price is under support 1
Type : Neutral
Timeframe : Weekly
An analysis of the price chart with the Central Patterns scanner (detector of chart patterns and resistances and supports) shows a result that can have an impact on the price change:
Horizontal support is broken
Type : Bearish
Timeframe : 1 hour
No result was found by the Central Candlesticks scanner on Japanese candlesticks.
| S3 | S2 | S1 | Price | R1 | R2 | R3 | |
|---|---|---|---|---|---|---|---|
| ProTrendLines | 5.55 | 6.28 | 6.51 | 6.66 | 6.73 | 6.92 | 7.09 |
| Change (%) | -16.67% | -5.71% | -2.25% | - | +1.05% | +3.90% | +6.46% |
| Change | -1.11 | -0.38 | -0.15 | - | +0.07 | +0.26 | +0.43 |
| Level | Minor | Major | Intermediate | - | Minor | Minor | Intermediate |
Attention could also be paid to pivot points to set price objectives:
| Pivot points | S3 | S2 | S1 | PP | R1 | R2 | R3 |
|---|---|---|---|---|---|---|---|
| Standard | 5.85 | 6.43 | 6.72 | 7.30 | 7.59 | 8.17 | 8.46 |
| Camarilla | 6.77 | 6.85 | 6.93 | 7.01 | 7.09 | 7.17 | 7.25 |
| Woodie | 5.71 | 6.36 | 6.58 | 7.23 | 7.45 | 8.10 | 8.32 |
| Fibonacci | 6.43 | 6.76 | 6.97 | 7.30 | 7.63 | 7.84 | 8.17 |
| Pivot points | S3 | S2 | S1 | PP | R1 | R2 | R3 |
|---|---|---|---|---|---|---|---|
| Standard | 5.31 | 5.91 | 6.79 | 7.39 | 8.27 | 8.87 | 9.75 |
| Camarilla | 7.26 | 7.40 | 7.53 | 7.67 | 7.81 | 7.94 | 8.08 |
| Woodie | 5.45 | 5.98 | 6.93 | 7.46 | 8.41 | 8.94 | 9.89 |
| Fibonacci | 5.91 | 6.48 | 6.83 | 7.39 | 7.96 | 8.31 | 8.87 |
| Pivot points | S3 | S2 | S1 | PP | R1 | R2 | R3 |
|---|---|---|---|---|---|---|---|
| Standard | -1.03 | 2.50 | 4.57 | 8.10 | 10.17 | 13.70 | 15.77 |
| Camarilla | 5.09 | 5.60 | 6.12 | 6.63 | 7.14 | 7.66 | 8.17 |
| Woodie | -1.77 | 2.14 | 3.83 | 7.74 | 9.43 | 13.34 | 15.03 |
| Fibonacci | 2.50 | 4.64 | 5.96 | 8.10 | 10.24 | 11.56 | 13.70 |
Numerical data
The following is the status of the technical indicators and moving averages at the time of publication of this technical analysis:
| RSI (14): | 33.06 | |
| MACD (12,26,9): | -0.1600 | |
| Directional Movement: | -19.84 | |
| AROON (14): | -64.28 | |
| DEMA (21): | 6.63 | |
| Parabolic SAR (0,02-0,02-0,2): | 6.94 | |
| Elder Ray (13): | -0.13 | |
| Super Trend (3,10): | 7.03 | |
| Zig ZAG (10): | 6.63 | |
| VORTEX (21): | 0.8600 | |
| Stochastique (14,3,5): | 39.08 | |
| TEMA (21): | 6.63 | |
| Williams %R (14): | -62.07 | |
| Chande Momentum Oscillator (20): | -0.33 | |
| Repulse (5,40,3): | -0.9900 | |
| ROCnROLL: | 2 | |
| TRIX (15,9): | -0.3400 | |
| Courbe Coppock: | 5.71 |
| MA7: | 7.39 | |
| MA20: | 7.17 | |
| MA50: | 8.11 | |
| MA100: | 6.26 | |
| MAexp7: | 6.71 | |
| MAexp20: | 6.86 | |
| MAexp50: | 7.13 | |
| MAexp100: | 7.30 | |
| Price / MA7: | -9.88% | |
| Price / MA20: | -7.11% | |
| Price / MA50: | -17.88% | |
| Price / MA100: | +6.39% | |
| Price / MAexp7: | -0.75% | |
| Price / MAexp20: | -2.92% | |
| Price / MAexp50: | -6.59% | |
| Price / MAexp100: | -8.77% |
About author

Online


Add a comment
Comments
0 comments on the analysis POLKADOT - DOT/USD - 1H