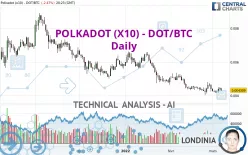
POLKADOT (X10) - DOT/BTC - Daily - Technical analysis published on 03/07/2022 (GMT)
- 254
- 0
Click here for a new analysis!
- Timeframe : Daily
- - Analysis generated on
- Status : INVALID

Summary of the analysis

Additional analysis
Quotes
The POLKADOT (X10) - DOT/BTC rating is 0.004309 BTC. The price is lower by -2.47% since the last closing with the lowest point at 0.004275 BTC and the highest point at 0.004419 BTC. The deviation from the price is +0.80% for the low point and -2.49% for the high point.The Central Gaps scanner detects a bullish opening marking the presence of buyers ahead of sellers at the opening but not sufficiently marked to allow the price to register a quotation gap.
Bullish opening
Type : Bullish
Timeframe : Openning
A study of price movements over other periods shows the following variations:
Technical
Technical analysis of this Daily chart of POLKADOT (X10) - DOT/BTC indicates that the overall trend is strongly bearish. 92.86% of the signals given by moving averages are bearish. The overall trend is supported by the strong bearish signals from short-term moving averages. The Central Indicators scanner detects a bearish signal on moving averages that could impact this trend:
Bearish price crossover with Moving Average 20
Type : Bearish
Timeframe : Daily
On the 18 technical indicators analysed, 6 are bullish, 9 are neutral and 3 are bearish. Central Indicators, the detector scanner for these technical indicators has recently detected several signals:
Pivot points : price is under support 1
Type : Neutral
Timeframe : Daily
Williams %R indicator is back under -50
Type : Bearish
Timeframe : Daily
Central Patterns, the market scanner focusing on chart patterns, resistances and supports found these results:
Near resistance of channel
Type : Bearish
Timeframe : Daily
Horizontal resistance is broken
Type : Bullish
Timeframe : Daily
Central Candlesticks, the scanner specialised in Japanese candlesticks, detects a bearish signal that could support the hypothesis of a small drop in the very short term:
Bearish engulfing lines
Type : Bearish
Timeframe : Daily
| S1 | Price | R1 | R2 | R3 | |
|---|---|---|---|---|---|
| ProTrendLines | 0.004220 | 0.004309 | 0.005151 | 0.006466 | 0.007930 |
| Change (%) | -2.07% | - | +19.54% | +50.06% | +84.03% |
| Change | -0.000089 | - | +0.000842 | +0.002157 | +0.003621 |
| Level | Major | - | Intermediate | Intermediate | Minor |
Attention could also be paid to pivot points to set price objectives:
| Pivot points | S3 | S2 | S1 | PP | R1 | R2 | R3 |
|---|---|---|---|---|---|---|---|
| Standard | 0.004108 | 0.004201 | 0.004310 | 0.004403 | 0.004512 | 0.004605 | 0.004714 |
| Camarilla | 0.004363 | 0.004381 | 0.004400 | 0.004418 | 0.004437 | 0.004455 | 0.004474 |
| Woodie | 0.004115 | 0.004205 | 0.004317 | 0.004407 | 0.004519 | 0.004609 | 0.004721 |
| Fibonacci | 0.004201 | 0.004279 | 0.004326 | 0.004403 | 0.004481 | 0.004528 | 0.004605 |
| Pivot points | S3 | S2 | S1 | PP | R1 | R2 | R3 |
|---|---|---|---|---|---|---|---|
| Standard | 0.003528 | 0.003836 | 0.004114 | 0.004422 | 0.004700 | 0.005008 | 0.005286 |
| Camarilla | 0.004232 | 0.004286 | 0.004339 | 0.004393 | 0.004447 | 0.004500 | 0.004554 |
| Woodie | 0.003514 | 0.003829 | 0.004100 | 0.004415 | 0.004686 | 0.005001 | 0.005272 |
| Fibonacci | 0.003836 | 0.004060 | 0.004198 | 0.004422 | 0.004646 | 0.004784 | 0.005008 |
| Pivot points | S3 | S2 | S1 | PP | R1 | R2 | R3 |
|---|---|---|---|---|---|---|---|
| Standard | 0.002499 | 0.003259 | 0.003825 | 0.004585 | 0.005151 | 0.005911 | 0.006477 |
| Camarilla | 0.004026 | 0.004148 | 0.004270 | 0.004391 | 0.004513 | 0.004634 | 0.004756 |
| Woodie | 0.002402 | 0.003211 | 0.003728 | 0.004537 | 0.005054 | 0.005863 | 0.006380 |
| Fibonacci | 0.003259 | 0.003766 | 0.004079 | 0.004585 | 0.005092 | 0.005405 | 0.005911 |
Numerical data
The following is the status of the technical indicators and moving averages at the time of publication of this technical analysis:
| RSI (14): | 41.21 | |
| MACD (12,26,9): | -0.0001 | |
| Directional Movement: | -5.785962 | |
| AROON (14): | 14.285715 | |
| DEMA (21): | 0.004236 | |
| Parabolic SAR (0,02-0,02-0,2): | 0.004150 | |
| Elder Ray (13): | -0.000026 | |
| Super Trend (3,10): | 0.004883 | |
| Zig ZAG (10): | 0.004312 | |
| VORTEX (21): | 0.9915 | |
| Stochastique (14,3,5): | 45.01 | |
| TEMA (21): | 0.004303 | |
| Williams %R (14): | -63.07 | |
| Chande Momentum Oscillator (20): | 0.000025 | |
| Repulse (5,40,3): | -0.4053 | |
| ROCnROLL: | 2 | |
| TRIX (15,9): | -0.4912 | |
| Courbe Coppock: | 2.57 |
| MA7: | 0.004305 | |
| MA20: | 0.004384 | |
| MA50: | 0.004773 | |
| MA100: | 0.005336 | |
| MAexp7: | 0.004346 | |
| MAexp20: | 0.004430 | |
| MAexp50: | 0.004781 | |
| MAexp100: | 0.005209 | |
| Price / MA7: | +0.09% | |
| Price / MA20: | -1.71% | |
| Price / MA50: | -9.72% | |
| Price / MA100: | -19.25% | |
| Price / MAexp7: | -0.85% | |
| Price / MAexp20: | -2.73% | |
| Price / MAexp50: | -9.87% | |
| Price / MAexp100: | -17.28% |
About author

Online


Add a comment
Comments
0 comments on the analysis POLKADOT (X10) - DOT/BTC - Daily