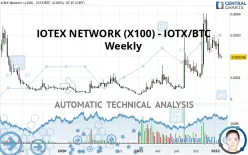
IOTEX (X100) - IOTX/BTC - Weekly - Technical analysis published on 02/03/2022 (GMT)
- 226
- 0
Click here for a new analysis!
- Timeframe : Weekly
- - Analysis generated on
- Status : TARGET REACHED

Summary of the analysis

Additional analysis
Quotes
IOTEX NETWORK (X100) - IOTX/BTC rating 0.000196 BTC. The price is lower by -3.45% over the 5 days and has been traded over the last 5 days between 0.000189 BTC and 0.000213 BTC. This implies that the 5 day price is +3.70% from its lowest point and -7.98% from its highest point.The Central Gaps scanner detects a bearish opening. A small advantage for sellers in the very short term.
Bearish opening
Type : Bearish
Timeframe : Openning
Here is a more detailed summary of the historical variations registered by IOTEX NETWORK (X100) - IOTX/BTC:
Near a new LOW record (1st january)
Type : Bearish
Timeframe : Weekly
Near a new LOW record (1 month)
Type : Bearish
Timeframe : Weekly
Technical
Technical analysis of IOTEX NETWORK (X100) - IOTX/BTC in Weekly shows an overall bullish trend. 75.00% of the signals given by moving averages are bullish. Caution: the neutral signals currently given by the short-term moving averages indicate that this bullish trend is showing signs of running out of steam. The Central Indicators market scanner is currently detecting a bearish signal that could impact this trend:
Bearish price crossover with adaptative moving average 20
Type : Bearish
Timeframe : Weekly
The technical indicators are generally neutral. They do not provide relevant information on the direction of future price movements.
Other results related to technical indicators were also found by the Central Indicators scanner:
Price is back under the pivot point
Type : Bearish
Timeframe : Weekly
Momentum indicator is back under 0
Type : Bearish
Timeframe : Weekly
Central Patterns, the scanner specializing in chart patterns, did not identify any signals.
The Central Candlesticks scanner, specialised in Japanese candlesticks, did not identify any signals.
| S2 | S1 | Price | R1 | R2 | R3 | |
|---|---|---|---|---|---|---|
| ProTrendLines | 0.000068 | 0.000114 | 0.000196 | 0.000224 | 0.000252 | 0.000291 |
| Change (%) | -65.31% | -41.84% | - | +14.29% | +28.57% | +48.47% |
| Change | -0.000128 | -0.000082 | - | +0.000028 | +0.000056 | +0.000095 |
| Level | Intermediate | Major | - | Intermediate | Intermediate | Minor |
Pivot points can also be used to set your price objectives. Here is the price situation in relation to pivot points:
| Pivot points | S3 | S2 | S1 | PP | R1 | R2 | R3 |
|---|---|---|---|---|---|---|---|
| Standard | 0.000184 | 0.000189 | 0.000193 | 0.000198 | 0.000202 | 0.000207 | 0.000211 |
| Camarilla | 0.000194 | 0.000194 | 0.000195 | 0.000196 | 0.000197 | 0.000198 | 0.000199 |
| Woodie | 0.000183 | 0.000189 | 0.000192 | 0.000198 | 0.000201 | 0.000207 | 0.000210 |
| Fibonacci | 0.000189 | 0.000193 | 0.000195 | 0.000198 | 0.000202 | 0.000204 | 0.000207 |
| Pivot points | S3 | S2 | S1 | PP | R1 | R2 | R3 |
|---|---|---|---|---|---|---|---|
| Standard | 0.000169 | 0.000178 | 0.000193 | 0.000202 | 0.000217 | 0.000226 | 0.000241 |
| Camarilla | 0.000200 | 0.000203 | 0.000205 | 0.000207 | 0.000209 | 0.000211 | 0.000214 |
| Woodie | 0.000171 | 0.000180 | 0.000195 | 0.000204 | 0.000219 | 0.000228 | 0.000243 |
| Fibonacci | 0.000178 | 0.000188 | 0.000193 | 0.000202 | 0.000212 | 0.000217 | 0.000226 |
| Pivot points | S3 | S2 | S1 | PP | R1 | R2 | R3 |
|---|---|---|---|---|---|---|---|
| Standard | 0.000063 | 0.000126 | 0.000158 | 0.000221 | 0.000253 | 0.000316 | 0.000348 |
| Camarilla | 0.000165 | 0.000174 | 0.000182 | 0.000191 | 0.000200 | 0.000208 | 0.000217 |
| Woodie | 0.000049 | 0.000118 | 0.000144 | 0.000213 | 0.000239 | 0.000308 | 0.000334 |
| Fibonacci | 0.000126 | 0.000162 | 0.000184 | 0.000221 | 0.000257 | 0.000279 | 0.000316 |
Numerical data
The following is the status of the technical indicators and moving averages at the time of publication of this technical analysis:
| RSI (14): | 50.11 | |
| MACD (12,26,9): | 0.0000 | |
| Directional Movement: | 13.227843 | |
| AROON (14): | 14.285714 | |
| DEMA (21): | 0.000251 | |
| Parabolic SAR (0,02-0,02-0,2): | 0.000391 | |
| Elder Ray (13): | -0.000022 | |
| Super Trend (3,10): | 0.000118 | |
| Zig ZAG (10): | 0.000196 | |
| VORTEX (21): | 1.0468 | |
| Stochastique (14,3,5): | 33.70 | |
| TEMA (21): | 0.000250 | |
| Williams %R (14): | -71.23 | |
| Chande Momentum Oscillator (20): | -0.000157 | |
| Repulse (5,40,3): | -21.0117 | |
| ROCnROLL: | -1 | |
| TRIX (15,9): | 3.7362 | |
| Courbe Coppock: | 132.69 |
| MA7: | 0.000199 | |
| MA20: | 0.000219 | |
| MA50: | 0.000240 | |
| MA100: | 0.000244 | |
| MAexp7: | 0.000224 | |
| MAexp20: | 0.000210 | |
| MAexp50: | 0.000158 | |
| MAexp100: | 0.000135 | |
| Price / MA7: | -1.51% | |
| Price / MA20: | -10.50% | |
| Price / MA50: | -18.33% | |
| Price / MA100: | -19.67% | |
| Price / MAexp7: | -12.50% | |
| Price / MAexp20: | -6.67% | |
| Price / MAexp50: | +24.05% | |
| Price / MAexp100: | +45.19% |
About author

Online


Add a comment
Comments
0 comments on the analysis IOTEX (X100) - IOTX/BTC - Weekly