HARMONY - ONE/USD - 1H - Technical analysis published on 03/11/2025 (GMT)
- 61
- 0
Click here for a new analysis!
- Timeframe : 1H
- - Analysis generated on
- Status : INVALID
Summary of the analysis

Additional analysis
Quotes
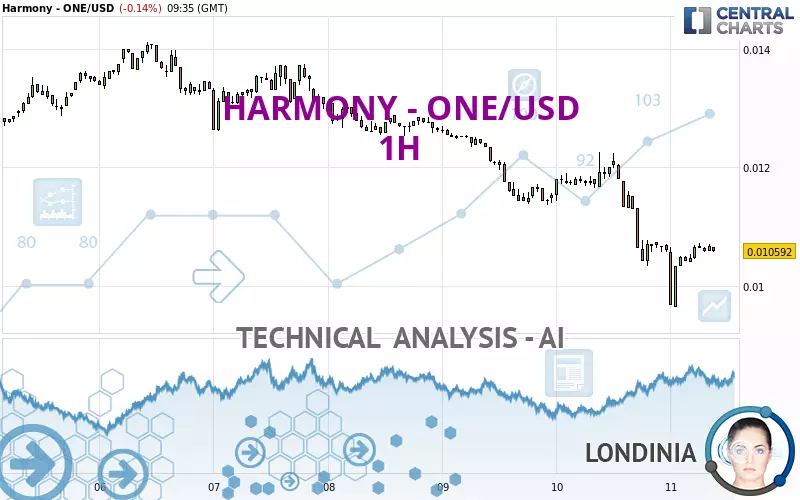
HARMONY - ONE/USD rating 0.010592 USD. The price registered a decrease of -0.14% on the session and was between 0.009648 USD and 0.010719 USD. This implies that the price is at +9.78% from its lowest and at -1.18% from its highest.A bearish opening was detected by the Central Gaps scanner. Sellers are trying to impose a bearish trend in the very short term.
Bearish opening
Type : Bearish
Timeframe : Openning
A study of price movements over other periods shows the following variations:
New LOW record (1st january)
Type : Bearish
Timeframe : Weekly
New LOW record (1 month)
Type : Bearish
Timeframe : Weekly
Technical
A technical analysis in 1H of this HARMONY - ONE/USD chart shows a sharp bearish trend. 92.86% of the signals given by moving averages are bearish. The overall trend is supported by the strong bearish signals from short-term moving averages. There is no crossing of moving average by the price or crossing of moving averages between themselves.
On the 18 technical indicators analysed, 10 are bullish, 3 are neutral and 5 are bearish. Caution: the Central Indicators scanner currently detects an excess:
Williams %R indicator is overbought : over -20
Type : Neutral
Timeframe : 1 hour
Pivot points : price is under support 1 (Weekly)
Type : Neutral
Timeframe : 1 hour
Pivot points : price is under support 1 (Monthly)
Type : Neutral
Timeframe : 1 hour
No signals are given by Central Patterns, a market scanner specialised in chart patterns, resistances and supports.
The presence of these bearish patterns in Japanese candlesticks detected by Central Candlesticks that could cause a correction in the very short term were also noted
Bearish harami
Type : Bearish
Timeframe : 1 hour
Bearish harami cross
Type : Bearish
Timeframe : 1 hour
| S1 | Price | R1 | R2 | R3 | |
|---|---|---|---|---|---|
| ProTrendLines | 0.009954 | 0.010592 | 0.011375 | 0.012623 | 0.013646 |
| Change (%) | -6.02% | - | +7.39% | +19.17% | +28.83% |
| Change | -0.000638 | - | +0.000783 | +0.002031 | +0.003054 |
| Level | Major | - | Intermediate | Intermediate | Major |
To determine price objectives, it is also possible to use the pivot points. Here is the price position in relation to pivot points:
| Pivot points | S3 | S2 | S1 | PP | R1 | R2 | R3 |
|---|---|---|---|---|---|---|---|
| Standard | 0.007944 | 0.009140 | 0.009873 | 0.011069 | 0.011802 | 0.012998 | 0.013731 |
| Camarilla | 0.010077 | 0.010253 | 0.010430 | 0.010607 | 0.010784 | 0.010961 | 0.011138 |
| Woodie | 0.007714 | 0.009024 | 0.009643 | 0.010953 | 0.011572 | 0.012882 | 0.013501 |
| Fibonacci | 0.009140 | 0.009877 | 0.010332 | 0.011069 | 0.011806 | 0.012261 | 0.012998 |
| Pivot points | S3 | S2 | S1 | PP | R1 | R2 | R3 |
|---|---|---|---|---|---|---|---|
| Standard | 0.006902 | 0.009464 | 0.011045 | 0.013607 | 0.015188 | 0.017750 | 0.019331 |
| Camarilla | 0.011486 | 0.011866 | 0.012245 | 0.012625 | 0.013005 | 0.013385 | 0.013764 |
| Woodie | 0.006411 | 0.009219 | 0.010554 | 0.013362 | 0.014697 | 0.017505 | 0.018840 |
| Fibonacci | 0.009464 | 0.011047 | 0.012025 | 0.013607 | 0.015190 | 0.016168 | 0.017750 |
| Pivot points | S3 | S2 | S1 | PP | R1 | R2 | R3 |
|---|---|---|---|---|---|---|---|
| Standard | 0.002738 | 0.007383 | 0.010964 | 0.015609 | 0.019190 | 0.023835 | 0.027416 |
| Camarilla | 0.012282 | 0.013036 | 0.013790 | 0.014544 | 0.015298 | 0.016052 | 0.016806 |
| Woodie | 0.002205 | 0.007117 | 0.010431 | 0.015343 | 0.018657 | 0.023569 | 0.026883 |
| Fibonacci | 0.007383 | 0.010526 | 0.012467 | 0.015609 | 0.018752 | 0.020693 | 0.023835 |
Numerical data
The following is the status of the technical indicators and moving averages at the time of publication of this technical analysis:
| RSI (14): | 44.07 | |
| MACD (12,26,9): | -0.0003 | |
| Directional Movement: | -19.268622 | |
| AROON (14): | -42.857143 | |
| DEMA (21): | 0.010400 | |
| Parabolic SAR (0,02-0,02-0,2): | 0.009879 | |
| Elder Ray (13): | 0.000011 | |
| Super Trend (3,10): | 0.011052 | |
| Zig ZAG (10): | 0.010652 | |
| VORTEX (21): | 0.7656 | |
| Stochastique (14,3,5): | 88.64 | |
| TEMA (21): | 0.010416 | |
| Williams %R (14): | -9.97 | |
| Chande Momentum Oscillator (20): | -0.000048 | |
| Repulse (5,40,3): | 0.4679 | |
| ROCnROLL: | -1 | |
| TRIX (15,9): | -0.4108 | |
| Courbe Coppock: | 6.33 |
| MA7: | 0.012178 | |
| MA20: | 0.013953 | |
| MA50: | 0.015853 | |
| MA100: | 0.022722 | |
| MAexp7: | 0.010600 | |
| MAexp20: | 0.010775 | |
| MAexp50: | 0.011319 | |
| MAexp100: | 0.011912 | |
| Price / MA7: | -13.02% | |
| Price / MA20: | -24.09% | |
| Price / MA50: | -33.19% | |
| Price / MA100: | -53.38% | |
| Price / MAexp7: | -0.08% | |
| Price / MAexp20: | -1.70% | |
| Price / MAexp50: | -6.42% | |
| Price / MAexp100: | -11.08% |
About author
Online


Add a comment
Comments
0 comments on the analysis HARMONY - ONE/USD - 1H