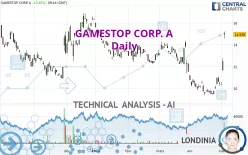
GAMESTOP CORP. A - Daily - Technical analysis published on 05/06/2024 (GMT)
- 162
- 0
Click here for a new analysis!
- Timeframe : Daily
- - Analysis generated on
- Status : TARGET REACHED

Summary of the analysis

Additional analysis
Quotes
The GAMESTOP CORP. A rating is 14.938 EUR. The price registered an increase of +19.49% on the session and was between 14.570 EUR and 15.182 EUR. This implies that the price is at +2.53% from its lowest and at -1.61% from its highest.The Central Gaps scanner detects a bullish gap which is a sign that buyers have taken the lead in the very short term.
Opening Gap UP
Type : Bullish
Timeframe : Openning
So that you have an overall view of the price change, here is a table showing the variations over several periods:
New HIGH record (1 month)
Type : Bullish
Timeframe : Weekly
The Central Volumes scanner notes the presence of abnormal volumes:
Abnormal volumes
Timeframe : 5 days
Technical
Technical analysis of this Daily chart of GAMESTOP CORP. A indicates that the overall trend is slightly bullish. 60.71% of the signals given by moving averages are bullish. The overall trend could accelerate as strong bullish signals from short-term moving averages are expected. An assessment of moving averages reveals several bullish signals that could impact this trend:
Bullish trend reversal : adaptative moving average 20
Type : Bullish
Timeframe : Daily
Bullish trend reversal : adaptative moving average 50
Type : Bullish
Timeframe : Daily
Bullish price crossover with Moving Average 100
Type : Bullish
Timeframe : Daily
Bullish price crossover with adaptative moving average 100
Type : Bullish
Timeframe : Daily
Technical indicators are strongly bullish, suggesting that the price increase should continue.
But beware of excesses. The Central Indicators scanner currently detects this:
RSI indicator is overbought : over 70
Type : Neutral
Timeframe : Daily
CCI indicator is overbought : over 100
Type : Neutral
Timeframe : Daily
Williams %R indicator is overbought : over -20
Type : Neutral
Timeframe : Daily
Pivot points : price is over resistance 2
Type : Neutral
Timeframe : Weekly
Pivot points : price is over resistance 3
Type : Neutral
Timeframe : Daily
MACD indicator is back over 0
Type : Bullish
Timeframe : Daily
Ichimoku - Bullish crossover : Tenkan & Kijun
Type : Bullish
Timeframe : Daily
Central Patterns, the market scanner focusing on chart patterns, resistances and supports found these results:
Horizontal resistance is broken
Type : Bullish
Timeframe : Daily
Resistance of channel is broken
Type : Bullish
Timeframe : Daily
Resistance of triangle is broken
Type : Bullish
Timeframe : Daily
The Central Candlesticks scanner which studies Japanese candlesticks did not detect anything.
| S3 | S2 | S1 | Price | R1 | R2 | R3 | |
|---|---|---|---|---|---|---|---|
| ProTrendLines | 10.974 | 12.478 | 13.553 | 14.938 | 15.281 | 16.624 | 17.792 |
| Change (%) | -26.54% | -16.47% | -9.27% | - | +2.30% | +11.29% | +19.11% |
| Change | -3.964 | -2.460 | -1.385 | - | +0.343 | +1.686 | +2.854 |
| Level | Intermediate | Minor | Intermediate | - | Intermediate | Minor | Minor |
To determine price objectives, it is also possible to use the pivot points. Here is the price position in relation to pivot points:
| Pivot points | S3 | S2 | S1 | PP | R1 | R2 | R3 |
|---|---|---|---|---|---|---|---|
| Standard | 10.635 | 11.107 | 11.805 | 12.277 | 12.975 | 13.447 | 14.145 |
| Camarilla | 12.180 | 12.288 | 12.395 | 12.502 | 12.609 | 12.717 | 12.824 |
| Woodie | 10.747 | 11.164 | 11.917 | 12.334 | 13.087 | 13.504 | 14.257 |
| Fibonacci | 11.107 | 11.554 | 11.830 | 12.277 | 12.724 | 13.000 | 13.447 |
| Pivot points | S3 | S2 | S1 | PP | R1 | R2 | R3 |
|---|---|---|---|---|---|---|---|
| Standard | 8.415 | 9.331 | 10.917 | 11.833 | 13.419 | 14.335 | 15.921 |
| Camarilla | 11.814 | 12.043 | 12.273 | 12.502 | 12.731 | 12.961 | 13.190 |
| Woodie | 8.749 | 9.499 | 11.251 | 12.001 | 13.753 | 14.503 | 16.255 |
| Fibonacci | 9.331 | 10.287 | 10.878 | 11.833 | 12.789 | 13.380 | 14.335 |
| Pivot points | S3 | S2 | S1 | PP | R1 | R2 | R3 |
|---|---|---|---|---|---|---|---|
| Standard | 7.665 | 8.519 | 9.493 | 10.347 | 11.321 | 12.175 | 13.149 |
| Camarilla | 9.963 | 10.131 | 10.298 | 10.466 | 10.634 | 10.801 | 10.969 |
| Woodie | 7.724 | 8.549 | 9.552 | 10.377 | 11.380 | 12.205 | 13.208 |
| Fibonacci | 8.519 | 9.218 | 9.649 | 10.347 | 11.046 | 11.477 | 12.175 |
Numerical data
The following is the status of the technical indicators and moving averages at the time of publication of this technical analysis:
| RSI (14): | 74.71 | |
| MACD (12,26,9): | 0.1550 | |
| Directional Movement: | 42.257 | |
| AROON (14): | 92.857 | |
| DEMA (21): | 10.996 | |
| Parabolic SAR (0,02-0,02-0,2): | 9.975 | |
| Elder Ray (13): | 3.665 | |
| Super Trend (3,10): | 12.318 | |
| Zig ZAG (10): | 14.860 | |
| VORTEX (21): | 0.9890 | |
| Stochastique (14,3,5): | 81.51 | |
| TEMA (21): | 11.658 | |
| Williams %R (14): | -5.96 | |
| Chande Momentum Oscillator (20): | 5.039 | |
| Repulse (5,40,3): | 3.9310 | |
| ROCnROLL: | 1 | |
| TRIX (15,9): | -0.5720 | |
| Courbe Coppock: | 29.40 |
| MA7: | 11.403 | |
| MA20: | 10.418 | |
| MA50: | 11.830 | |
| MA100: | 12.961 | |
| MAexp7: | 11.853 | |
| MAexp20: | 11.064 | |
| MAexp50: | 11.608 | |
| MAexp100: | 12.585 | |
| Price / MA7: | +31.00% | |
| Price / MA20: | +43.39% | |
| Price / MA50: | +26.27% | |
| Price / MA100: | +15.25% | |
| Price / MAexp7: | +26.03% | |
| Price / MAexp20: | +35.01% | |
| Price / MAexp50: | +28.69% | |
| Price / MAexp100: | +18.70% |
About author
Online


Add a comment
Comments
0 comments on the analysis GAMESTOP CORP. A - Daily