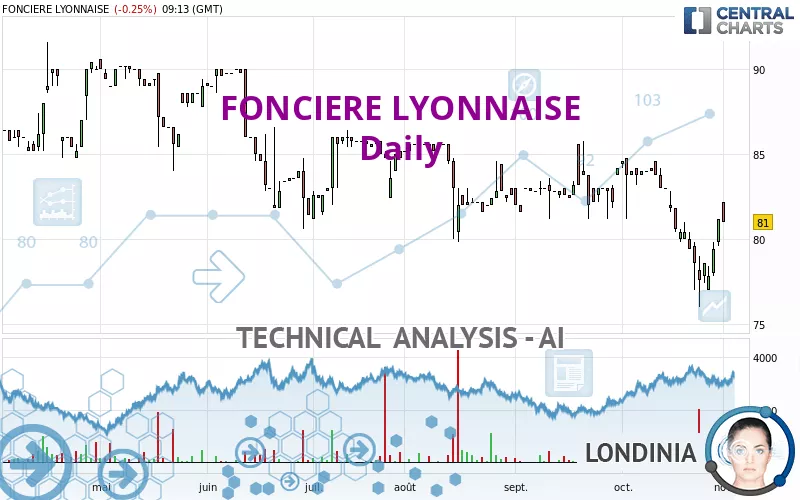
FONCIERE LYONNAISE - Daily - Technical analysis published on 11/01/2022 (GMT)
- 208
- 0
Click here for a new analysis!
- Timeframe : Daily
- - Analysis generated on
- Status : LEVEL MAINTAINED
Summary of the analysis

Additional analysis
Quotes
The FONCIERE LYONNAISE price is 81.0 EUR. On the day, this instrument lost -0.25% and was traded between 81.0 EUR and 82.2 EUR over the period. The price is currently at 0% from its lowest and -1.46% from its highest.The Central Gaps scanner detects a bullish gap which is a sign that buyers have taken the lead in the very short term.
Opening Gap UP
Type : Bullish
Timeframe : Openning
So that you have an overall view of the price change, here is a table showing the variations over several periods:
Near a new HIGH record (1 month)
Type : Bullish
Timeframe : Weekly
Technical
Technical analysis of FONCIERE LYONNAISE in Daily shows a overall strongly bearish trend. 82.14% of the signals given by moving averages are bearish. Caution: as the signals currently given by short-term moving averages are rather neutral, the strongly bearish trend is showing signs of running out of steam. The Central Indicators market scanner is currently detecting a bullish signal that could impact this trend:
Bullish trend reversal : adaptative moving average 20
Type : Bullish
Timeframe : Daily
The technical indicators are bullish. There is still some doubt about the price increase.
Other results related to technical indicators were also found by the Central Indicators scanner:
Pivot points : price is over resistance 1
Type : Neutral
Timeframe : Weekly
MACD crosses UP its Moving Average
Type : Bullish
Timeframe : Daily
An analysis of the price chart with the Central Patterns scanner (detector of chart patterns and resistances and supports) shows a result that can have an impact on the price change:
Near horizontal resistance
Type : Bearish
Timeframe : Daily
The Central Candlesticks scanner, specialised in Japanese candlesticks, did not identify any signals.
| S3 | S2 | S1 | Price | R1 | R2 | R3 | |
|---|---|---|---|---|---|---|---|
| ProTrendLines | 73.6 | 78.1 | 79.4 | 81.0 | 81.5 | 85.7 | 89.4 |
| Change (%) | -9.14% | -3.58% | -1.98% | - | +0.62% | +5.80% | +10.37% |
| Change | -7.4 | -2.9 | -1.6 | - | +0.5 | +4.7 | +8.4 |
| Level | Major | Minor | Intermediate | - | Major | Intermediate | Minor |
Attention could also be paid to pivot points to set price objectives:
| Pivot points | S3 | S2 | S1 | PP | R1 | R2 | R3 |
|---|---|---|---|---|---|---|---|
| Standard | 78.5 | 79.1 | 80.1 | 80.7 | 81.7 | 82.3 | 83.3 |
| Camarilla | 80.8 | 80.9 | 81.1 | 81.2 | 81.4 | 81.5 | 81.6 |
| Woodie | 78.8 | 79.2 | 80.4 | 80.8 | 82.0 | 82.4 | 83.6 |
| Fibonacci | 79.1 | 79.7 | 80.1 | 80.7 | 81.3 | 81.7 | 82.3 |
| Pivot points | S3 | S2 | S1 | PP | R1 | R2 | R3 |
|---|---|---|---|---|---|---|---|
| Standard | 73.2 | 74.6 | 77.0 | 78.4 | 80.8 | 82.2 | 84.6 |
| Camarilla | 78.4 | 78.7 | 79.1 | 79.4 | 79.8 | 80.1 | 80.5 |
| Woodie | 73.7 | 74.9 | 77.5 | 78.7 | 81.3 | 82.5 | 85.1 |
| Fibonacci | 74.6 | 76.1 | 77.0 | 78.4 | 79.9 | 80.8 | 82.2 |
| Pivot points | S3 | S2 | S1 | PP | R1 | R2 | R3 |
|---|---|---|---|---|---|---|---|
| Standard | 67.7 | 71.9 | 76.5 | 80.7 | 85.3 | 89.5 | 94.1 |
| Camarilla | 78.8 | 79.6 | 80.4 | 81.2 | 82.0 | 82.8 | 83.6 |
| Woodie | 68.0 | 72.0 | 76.8 | 80.8 | 85.6 | 89.6 | 94.4 |
| Fibonacci | 71.9 | 75.2 | 77.3 | 80.7 | 84.0 | 86.1 | 89.5 |
Numerical data
The following are the details of the technical indicators and moving averages that were collected to generate this technical analysis:
| RSI (14): | 48.90 | |
| MACD (12,26,9): | -0.9000 | |
| Directional Movement: | -9.4 | |
| AROON (14): | -64.3 | |
| DEMA (21): | 79.6 | |
| Parabolic SAR (0,02-0,02-0,2): | 76.1 | |
| Elder Ray (13): | 1.3 | |
| Super Trend (3,10): | 81.5 | |
| Zig ZAG (10): | 81.0 | |
| VORTEX (21): | 0.9000 | |
| Stochastique (14,3,5): | 53.70 | |
| TEMA (21): | 79.1 | |
| Williams %R (14): | -39.00 | |
| Chande Momentum Oscillator (20): | -2.0 | |
| Repulse (5,40,3): | 1.0000 | |
| ROCnROLL: | -1 | |
| TRIX (15,9): | -0.2000 | |
| Courbe Coppock: | 9.70 |
| MA7: | 79.2 | |
| MA20: | 81.3 | |
| MA50: | 82.2 | |
| MA100: | 83.2 | |
| MAexp7: | 80.0 | |
| MAexp20: | 80.8 | |
| MAexp50: | 82.0 | |
| MAexp100: | 82.8 | |
| Price / MA7: | +2.27% | |
| Price / MA20: | -0.37% | |
| Price / MA50: | -1.46% | |
| Price / MA100: | -2.64% | |
| Price / MAexp7: | +1.25% | |
| Price / MAexp20: | +0.25% | |
| Price / MAexp50: | -1.22% | |
| Price / MAexp100: | -2.17% |
News
The last news published on FONCIERE LYONNAISE at the time of the generation of this analysis was as follows:
- Half-yearly report on the SFL liquidity contract
- SFL, a Leader in CSR Policy
- SFL – Third-Quarter 2022 Financial Information
- SFL Announces the Early Redemption of Its €500,000,000 2.25 Per Cent. Notes Due 16 November 2022
- SFL - First-Half 2022 Results
About author
Online


Add a comment
Comments
0 comments on the analysis FONCIERE LYONNAISE - Daily