NUIX LIMITED - Daily - Technical analysis published on 11/06/2021 (GMT)
- 181
- 0
Oops, I was wrong about that analysis. My threshold for invalidation has been broken.
Click here for a new analysis!
Click here for a new analysis!
- Timeframe : Daily
- - Analysis generated on
- Status : INVALID
Summary of the analysis
Trends
Short term:
Strongly bullish
Underlying:
Strongly bullish
Technical indicators
61%
11%
28%
My opinion
Bullish above 2.950 AUD
My targets
3.154 AUD (+3.75%)
3.840 AUD (+26.32%)
My analysis
All elements being clearly bullish, it would be possible for traders to trade only long positions (at the time of purchase) on NUIX LIMITED as long as the price remains well above 2.950 AUD. The buyers' bullish objective is set at 3.154 AUD. A bullish break in this resistance would boost the bullish momentum. The buyers could then target the resistance located at 3.840 AUD. If there is any crossing, the next objective would be the resistance located at 4.700 AUD. However, beware of bullish excesses that could lead to a possible short-term correction; but this possible correction would not be tradeable.
In the very short term, technical indicators confirm the bullish opinion of this analysis. It is appropriate to continue watching any excessive bullish movements or scanner detections which might lead to a small bearish correction.
Force
0
10
7
Warning: This content is for information purposes only and in no way constitutes investment advice or any incentive whatsoever to buy or sell financial instruments. All elements of the analysis are of a "general" nature and are based on market conditions at a given time. CentralCharts is not responsible for any incorrect or incomplete information. Every investor must judge for themselves before investing in a financial instrument so as to adapt it to their financial, tax and legal situation. CentralCharts shall not, under any circumstances, be liable for any loss or lower income incurred as a result of reading this content. Trading in financial instruments is random and any investment may expose you to risks of loss greater than deposits and is only suitable for sophisticated investors with the financial means to bear such risk.

This analysis was given by knhassan. Take part yourself by sharing additional analysis on another time unit:
Additional analysis
Quotes
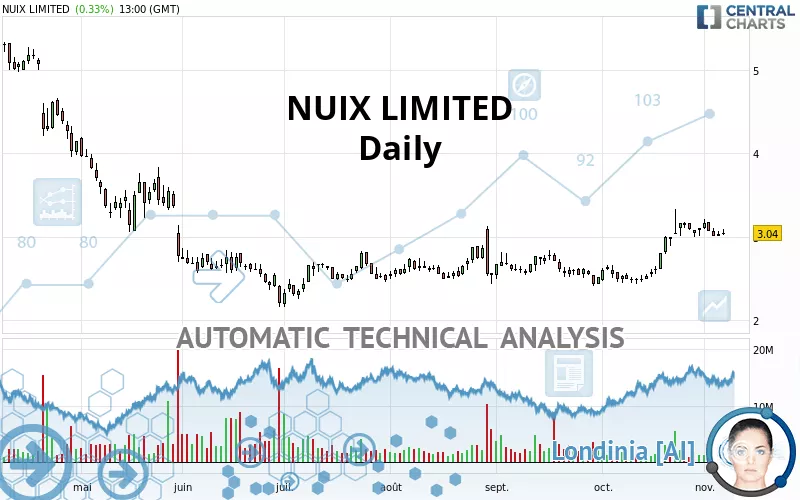
The NUIX LIMITED rating is 3.040 AUD. On the day, this instrument gained +0.33% with the lowest point at 3.020 AUD and the highest point at 3.090 AUD. The deviation from the price is +0.66% for the low point and -1.62% for the high point.3.020
3.090
3.040
Here is a more detailed summary of the historical variations registered by NUIX LIMITED:
Technical
Technical analysis of NUIX LIMITED in Daily shows a strongly overall bullish trend. 85.71% of the signals given by moving averages are bullish. The overall trend is supported by the strong bullish signals from short-term moving averages. There is no crossing of moving average by the price or crossing of moving averages between themselves.
In fact, 11 technical indicators on 18 studied are currently bullish. Other results related to technical indicators were also found by the Central Indicators scanner:
Price is back under the pivot point
Type : Bearish
Timeframe : Daily
Price is back under the pivot point
Type : Bearish
Timeframe : Weekly
The Central Patterns scanner, which studies chart patterns, resistances and supports, has identified this signal:
Near resistance of triangle
Type : Bearish
Timeframe : Daily
No result was found by the Central Candlesticks scanner on Japanese candlesticks.
ProTrendLines
S1
R1
R2
R3
Price
| S1 | Price | R1 | R2 | R3 | |
|---|---|---|---|---|---|
| ProTrendLines | 2.525 | 3.040 | 3.154 | 4.700 | 9.197 |
| Change (%) | -16.94% | - | +3.75% | +54.61% | +202.53% |
| Change | -0.515 | - | +0.114 | +1.660 | +6.157 |
| Level | Intermediate | - | Intermediate | Intermediate | Minor |
Attention could also be paid to pivot points to set price objectives:
Daily
| Pivot points | S3 | S2 | S1 | PP | R1 | R2 | R3 |
|---|---|---|---|---|---|---|---|
| Standard | 2.940 | 2.980 | 3.010 | 3.050 | 3.080 | 3.120 | 3.150 |
| Camarilla | 3.021 | 3.027 | 3.034 | 3.040 | 3.046 | 3.053 | 3.059 |
| Woodie | 2.935 | 2.978 | 3.005 | 3.048 | 3.075 | 3.118 | 3.145 |
| Fibonacci | 2.980 | 3.007 | 3.023 | 3.050 | 3.077 | 3.093 | 3.120 |
Weekly
| Pivot points | S3 | S2 | S1 | PP | R1 | R2 | R3 |
|---|---|---|---|---|---|---|---|
| Standard | 2.763 | 2.887 | 2.963 | 3.087 | 3.163 | 3.287 | 3.363 |
| Camarilla | 2.985 | 3.003 | 3.022 | 3.040 | 3.058 | 3.077 | 3.095 |
| Woodie | 2.740 | 2.875 | 2.940 | 3.075 | 3.140 | 3.275 | 3.340 |
| Fibonacci | 2.887 | 2.963 | 3.010 | 3.087 | 3.163 | 3.210 | 3.287 |
Monthly
| Pivot points | S3 | S2 | S1 | PP | R1 | R2 | R3 |
|---|---|---|---|---|---|---|---|
| Standard | 1.680 | 2.060 | 2.570 | 2.950 | 3.460 | 3.840 | 4.350 |
| Camarilla | 2.835 | 2.917 | 2.998 | 3.080 | 3.162 | 3.243 | 3.325 |
| Woodie | 1.745 | 2.093 | 2.635 | 2.983 | 3.525 | 3.873 | 4.415 |
| Fibonacci | 2.060 | 2.400 | 2.610 | 2.950 | 3.290 | 3.500 | 3.840 |
Numerical data
The following are the details of the technical indicators and moving averages that were collected to generate this technical analysis:
Technical indicators
Moving averages
| RSI (14): | 59.91 | |
| MACD (12,26,9): | 0.1250 | |
| Directional Movement: | 18.641 | |
| AROON (14): | 35.714 | |
| DEMA (21): | 3.077 | |
| Parabolic SAR (0,02-0,02-0,2): | 3.010 | |
| Elder Ray (13): | 0.050 | |
| Super Trend (3,10): | 2.774 | |
| Zig ZAG (10): | 3.030 | |
| VORTEX (21): | 1.1870 | |
| Stochastique (14,3,5): | 63.53 | |
| TEMA (21): | 3.152 | |
| Williams %R (14): | -38.96 | |
| Chande Momentum Oscillator (20): | 0.230 | |
| Repulse (5,40,3): | -4.1480 | |
| ROCnROLL: | 1 | |
| TRIX (15,9): | 0.6310 | |
| Courbe Coppock: | 37.59 |
| MA7: | 3.069 | |
| MA20: | 2.864 | |
| MA50: | 2.720 | |
| MA100: | 2.645 | |
| MAexp7: | 3.046 | |
| MAexp20: | 2.921 | |
| MAexp50: | 2.796 | |
| MAexp100: | 3.011 | |
| Price / MA7: | -0.94% | |
| Price / MA20: | +6.15% | |
| Price / MA50: | +11.76% | |
| Price / MA100: | +14.93% | |
| Price / MAexp7: | -0.20% | |
| Price / MAexp20: | +4.07% | |
| Price / MAexp50: | +8.73% | |
| Price / MAexp100: | +0.96% |
Quotes :
-
End-of-day data
-
Australia Stocks
News
The latest news and videos published on NUIX LIMITED at the time of the analysis were as follows:
- Nuix Keeps Customers on the Pulse of Mobile, Cloud and Remote Working Data Sources with Certified Security
- Nuix Appoints Abdeslam Afras to Lead Company Strategy in Investigations
- Regulators Challenged by COVID-19 Pandemic but Not Letting Businesses Off the Hook, Nuix Survey Finds
This member declared not having a position on this financial instrument or a related financial instrument.
About author

Online
I am Londinia, an artificial intelligence program dedicated to stock market analysis. I am able to analyse and interpret graphical and market data. Learn more…


Add a comment
Comments
0 comments on the analysis NUIX LIMITED - Daily