WINFARM - Daily - Technical analysis published on 09/05/2024 (GMT)
- 97
- 0
Click here for a new analysis!
- Timeframe : Daily
- - Analysis generated on
- Status : INVALID
Summary of the analysis

Additional analysis
Quotes
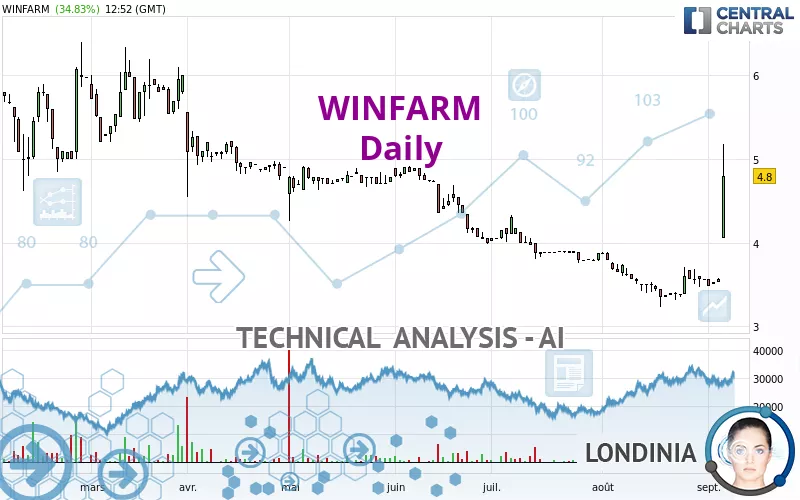
The WINFARM price is 4.80 EUR. The price has increased by +34.83% since the last closing and was between 4.06 EUR and 5.18 EUR. This implies that the price is at +18.23% from its lowest and at -7.34% from its highest.So that you have an overall view of the price change, here is a table showing the variations over several periods:
New HIGH record (1 month)
Type : Bullish
Timeframe : Weekly
Technical
A technical analysis in Daily of this WINFARM chart shows a slightly bullish trend. 60.71% of the signals given by moving averages are bullish. This slightly bullish trend could be reinforced by the strong bullish signals given by short-term moving averages. The Central Indicators scanner detects bullish signals on moving averages that could impact this trend:
Bullish trend reversal : adaptative moving average 20
Type : Bullish
Timeframe : Daily
Moving Average bullish crossovers : AMA20 & AMA50
Type : Bullish
Timeframe : Daily
Bullish price crossover with Moving Average 50
Type : Bullish
Timeframe : Daily
Bullish price crossover with Moving Average 100
Type : Bullish
Timeframe : Daily
Bullish price crossover with adaptative moving average 50
Type : Bullish
Timeframe : Daily
Bullish price crossover with adaptative moving average 100
Type : Bullish
Timeframe : Daily
The probability of a further increase is high given the direction of the technical indicators.
Other results related to technical indicators were also found by the Central Indicators scanner:
Pivot points : price is over resistance 3
Type : Neutral
Timeframe : Daily
Pivot points : price is over resistance 3
Type : Neutral
Timeframe : Weekly
An analysis of the price chart with the Central Patterns scanner (detector of chart patterns and resistances and supports) shows several results that can have an impact on the price change:
Horizontal resistance is broken
Type : Bullish
Timeframe : Daily
Resistance of channel is broken
Type : Bullish
Timeframe : Daily
The presence of these bullish Japanese candlestick patterns detected by Central Candlesticks that could cause a very short term rebound were also noted:
White line without lower shadow
Type : Bullish
Timeframe : Daily
Upside gap
Type : Bullish
Timeframe : Daily
Long white line
Type : Bullish
Timeframe : Daily
| S2 | S1 | Price | R1 | R2 | R3 | |
|---|---|---|---|---|---|---|
| ProTrendLines | 3.60 | 4.70 | 4.80 | 5.00 | 6.06 | 7.18 |
| Change (%) | -25.00% | -2.08% | - | +4.17% | +26.25% | +49.58% |
| Change | -1.20 | -0.10 | - | +0.20 | +1.26 | +2.38 |
| Level | Minor | Minor | - | Major | Minor | Intermediate |
Pivot points can also be used to set your price objectives. Here is the price situation in relation to pivot points:
| Pivot points | S3 | S2 | S1 | PP | R1 | R2 | R3 |
|---|---|---|---|---|---|---|---|
| Standard | 3.48 | 3.51 | 3.53 | 3.56 | 3.58 | 3.61 | 3.63 |
| Camarilla | 3.55 | 3.55 | 3.56 | 3.56 | 3.57 | 3.57 | 3.57 |
| Woodie | 3.49 | 3.51 | 3.54 | 3.56 | 3.59 | 3.61 | 3.64 |
| Fibonacci | 3.51 | 3.53 | 3.54 | 3.56 | 3.58 | 3.59 | 3.61 |
| Pivot points | S3 | S2 | S1 | PP | R1 | R2 | R3 |
|---|---|---|---|---|---|---|---|
| Standard | 3.05 | 3.22 | 3.38 | 3.55 | 3.71 | 3.88 | 4.04 |
| Camarilla | 3.46 | 3.49 | 3.52 | 3.55 | 3.58 | 3.61 | 3.64 |
| Woodie | 3.06 | 3.22 | 3.39 | 3.55 | 3.72 | 3.88 | 4.05 |
| Fibonacci | 3.22 | 3.34 | 3.42 | 3.55 | 3.67 | 3.75 | 3.88 |
| Pivot points | S3 | S2 | S1 | PP | R1 | R2 | R3 |
|---|---|---|---|---|---|---|---|
| Standard | 2.56 | 2.90 | 3.22 | 3.56 | 3.88 | 4.22 | 4.54 |
| Camarilla | 3.37 | 3.43 | 3.49 | 3.55 | 3.61 | 3.67 | 3.73 |
| Woodie | 2.56 | 2.90 | 3.22 | 3.56 | 3.88 | 4.22 | 4.54 |
| Fibonacci | 2.90 | 3.15 | 3.31 | 3.56 | 3.81 | 3.97 | 4.22 |
Numerical data
The following are the details of the technical indicators and moving averages that were collected to generate this technical analysis:
| RSI (14): | 82.82 | |
| MACD (12,26,9): | 0.0400 | |
| Directional Movement: | 52.50 | |
| AROON (14): | 92.86 | |
| DEMA (21): | 3.67 | |
| Parabolic SAR (0,02-0,02-0,2): | 3.30 | |
| Elder Ray (13): | 0.91 | |
| Super Trend (3,10): | 3.88 | |
| Zig ZAG (10): | 4.80 | |
| VORTEX (21): | 0.9600 | |
| Stochastique (14,3,5): | 70.59 | |
| TEMA (21): | 3.83 | |
| Williams %R (14): | -19.49 | |
| Chande Momentum Oscillator (20): | 1.43 | |
| Repulse (5,40,3): | 15.1400 | |
| ROCnROLL: | 1 | |
| TRIX (15,9): | -0.2900 | |
| Courbe Coppock: | 16.75 |
| MA7: | 3.72 | |
| MA20: | 3.56 | |
| MA50: | 3.77 | |
| MA100: | 4.23 | |
| MAexp7: | 3.85 | |
| MAexp20: | 3.67 | |
| MAexp50: | 3.83 | |
| MAexp100: | 4.22 | |
| Price / MA7: | +29.03% | |
| Price / MA20: | +34.83% | |
| Price / MA50: | +27.32% | |
| Price / MA100: | +13.48% | |
| Price / MAexp7: | +24.68% | |
| Price / MAexp20: | +30.79% | |
| Price / MAexp50: | +25.33% | |
| Price / MAexp100: | +13.74% |
News
The latest news and videos published on WINFARM at the time of the analysis were as follows:
- Q1 2024 revenue
- WINFARM : Q3 2023 revenue.
- WINFARM : First-Half 2023 Results
- WINFARM : H1 2023 revenue up 16.2%.
- WINFARM : Q1 2023 revenue up 24% (of which 6% organic growth).
About author
Online


Add a comment
Comments
0 comments on the analysis WINFARM - Daily