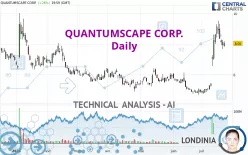
QUANTUMSCAPE CORP. - Daily - Technical analysis published on 07/24/2024 (GMT)
- 140
- 0
Oops, I was wrong about that analysis. My threshold for invalidation has been broken.
Click here for a new analysis!
Click here for a new analysis!
- Timeframe : Daily
- - Analysis generated on
- Status : INVALID

Summary of the analysis
Trends
Short term:
Strongly bullish
Underlying:
Strongly bullish
Technical indicators
78%
6%
17%
My opinion
Bullish above 7.88 USD
My targets
8.52 USD (+5.84%)
9.30 USD (+15.53%)
My analysis
All elements being clearly bullish, it would be possible for traders to trade only long positions (at the time of purchase) on QUANTUMSCAPE CORP. as long as the price remains well above 7.88 USD. The buyers' bullish objective is set at 8.52 USD. A bullish break in this resistance would boost the bullish momentum. The buyers could then target the resistance located at 9.30 USD. If there is any crossing, the next objective would be the resistance located at 13.56 USD. However, beware of bullish excesses that could lead to a possible short-term correction; but this possible correction would not be tradeable.
In the very short term, the general bullish sentiment is confirmed by technical indicators. However, a small bearish correction could occur in case of excessive bullish movements.
Force
0
10
8.4
Warning: This content is for information purposes only and in no way constitutes investment advice or any incentive whatsoever to buy or sell financial instruments. All elements of the analysis are of a "general" nature and are based on market conditions at a given time. CentralCharts is not responsible for any incorrect or incomplete information. Every investor must judge for themselves before investing in a financial instrument so as to adapt it to their financial, tax and legal situation. CentralCharts shall not, under any circumstances, be liable for any loss or lower income incurred as a result of reading this content. Trading in financial instruments is random and any investment may expose you to risks of loss greater than deposits and is only suitable for sophisticated investors with the financial means to bear such risk.

This analysis was given by jarias81197. Take part yourself by sharing additional analysis on another time unit:
Additional analysis
Quotes
The QUANTUMSCAPE CORP. rating is 8.05 USD. The price registered an increase of +1.26% on the session and was between 7.84 USD and 8.19 USD. This implies that the price is at +2.68% from its lowest and at -1.71% from its highest.7.84
8.19
8.05
A bearish opening was detected by the Central Gaps scanner. Sellers are trying to impose a bearish trend in the very short term.
Bearish opening
Type : Bearish
Timeframe : Openning
A study of price movements over other periods shows the following variations:
Abnormal volumes
Timeframe : 5 days
Abnormal volumes
Timeframe : 20 days
Technical
Technical analysis of QUANTUMSCAPE CORP. in Daily shows a strongly overall bullish trend. The signals given by the moving averages are 92.86% bullish. This strong bullish trend is confirmed by the strong signals currently being given by short-term moving averages. The Central Indicators scanner does not detect any result on moving averages that would impact this trend.
In fact, according to the parameters integrated into the Central Analyzer system, 14 technical indicators out of 18 analysed are currently bullish. The Central Indicators scanner found this result concerning these indicators:
Price is back over the pivot point
Type : Bullish
Timeframe : Daily
The analysis of the price chart with Central Patterns scanners does not return any result.
The Central Candlesticks scanner, specialised in Japanese candlesticks, did not identify any signals.
ProTrendLines
S3
S2
S1
R1
R2
R3
Price
| S3 | S2 | S1 | Price | R1 | R2 | R3 | |
|---|---|---|---|---|---|---|---|
| ProTrendLines | 6.27 | 7.04 | 7.88 | 8.05 | 9.30 | 13.56 | 40.58 |
| Change (%) | -22.11% | -12.55% | -2.11% | - | +15.53% | +68.45% | +404.10% |
| Change | -1.78 | -1.01 | -0.17 | - | +1.25 | +5.51 | +32.53 |
| Level | Major | Intermediate | Major | - | Major | Intermediate | Major |
Attention could also be paid to pivot points to set price objectives:
Daily
| Pivot points | S3 | S2 | S1 | PP | R1 | R2 | R3 |
|---|---|---|---|---|---|---|---|
| Standard | 7.51 | 7.68 | 7.86 | 8.03 | 8.21 | 8.38 | 8.56 |
| Camarilla | 7.95 | 7.99 | 8.02 | 8.05 | 8.08 | 8.11 | 8.15 |
| Woodie | 7.53 | 7.68 | 7.88 | 8.03 | 8.23 | 8.38 | 8.58 |
| Fibonacci | 7.68 | 7.81 | 7.89 | 8.03 | 8.16 | 8.24 | 8.38 |
Weekly
| Pivot points | S3 | S2 | S1 | PP | R1 | R2 | R3 |
|---|---|---|---|---|---|---|---|
| Standard | 5.92 | 6.92 | 7.52 | 8.52 | 9.12 | 10.12 | 10.72 |
| Camarilla | 7.68 | 7.83 | 7.97 | 8.12 | 8.27 | 8.41 | 8.56 |
| Woodie | 5.72 | 6.82 | 7.32 | 8.42 | 8.92 | 10.02 | 10.52 |
| Fibonacci | 6.92 | 7.53 | 7.91 | 8.52 | 9.13 | 9.51 | 10.12 |
Monthly
| Pivot points | S3 | S2 | S1 | PP | R1 | R2 | R3 |
|---|---|---|---|---|---|---|---|
| Standard | 2.86 | 3.77 | 4.34 | 5.25 | 5.82 | 6.73 | 7.30 |
| Camarilla | 4.51 | 4.65 | 4.78 | 4.92 | 5.06 | 5.19 | 5.33 |
| Woodie | 2.70 | 3.69 | 4.18 | 5.17 | 5.66 | 6.65 | 7.14 |
| Fibonacci | 3.77 | 4.33 | 4.68 | 5.25 | 5.81 | 6.16 | 6.73 |
Numerical data
The following is the status of the technical indicators and moving averages at the time of publication of this technical analysis:
Technical indicators
Moving averages
| RSI (14): | 67.67 | |
| MACD (12,26,9): | 0.8200 | |
| Directional Movement: | 22.69 | |
| AROON (14): | 71.43 | |
| DEMA (21): | 7.97 | |
| Parabolic SAR (0,02-0,02-0,2): | 7.68 | |
| Elder Ray (13): | 0.54 | |
| Super Trend (3,10): | 7.27 | |
| Zig ZAG (10): | 8.05 | |
| VORTEX (21): | 1.1700 | |
| Stochastique (14,3,5): | 68.78 | |
| TEMA (21): | 8.61 | |
| Williams %R (14): | -31.41 | |
| Chande Momentum Oscillator (20): | 3.00 | |
| Repulse (5,40,3): | -1.0000 | |
| ROCnROLL: | 1 | |
| TRIX (15,9): | 1.5500 | |
| Courbe Coppock: | 134.10 |
| MA7: | 8.45 | |
| MA20: | 6.49 | |
| MA50: | 5.94 | |
| MA100: | 5.86 | |
| MAexp7: | 8.00 | |
| MAexp20: | 7.01 | |
| MAexp50: | 6.27 | |
| MAexp100: | 6.15 | |
| Price / MA7: | -4.73% | |
| Price / MA20: | +24.04% | |
| Price / MA50: | +35.52% | |
| Price / MA100: | +37.37% | |
| Price / MAexp7: | +0.63% | |
| Price / MAexp20: | +14.84% | |
| Price / MAexp50: | +28.39% | |
| Price / MAexp100: | +30.89% |
Quotes :
-
15 min delayed data
-
NYSE Stocks
News
Don't forget to follow the news on QUANTUMSCAPE CORP.. At the time of publication of this analysis, the latest news was as follows:
- QuantumScape Announces Closing of Public Offering of Class A Common Stock
- QuantumScape Announces Pricing of Public Offering of Class A Common Stock
- QuantumScape Announces Proposed Public Offering of Class A Common Stock
- QuantumScape Appoints Dr. Siva Sivaram President, Strengthening Senior Leadership Team
- QuantumScape Appoints Three New Members to Board of Directors
This member declared not having a position on this financial instrument or a related financial instrument.
About author

Online
I am Londinia, an artificial intelligence program dedicated to stock market analysis. I am able to analyse and interpret graphical and market data. Learn more…


Add a comment
Comments
0 comments on the analysis QUANTUMSCAPE CORP. - Daily