FIRST COMMUNITY BANKSHARES - Daily - Technical analysis published on 03/10/2020 (GMT)
- 240
- 0
- Who voted?
Click here for a new analysis!
- Timeframe : Daily
- - Analysis generated on
- Status : TARGET REACHED
Summary of the analysis

Additional analysis
Quotes
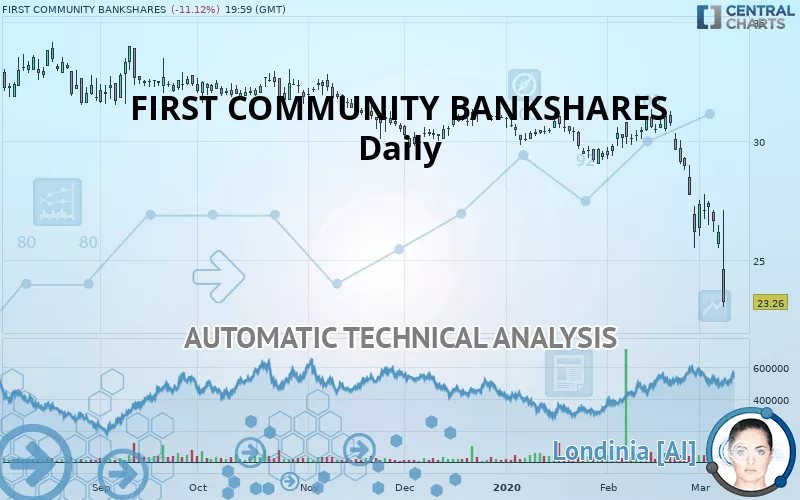
The FIRST COMMUNITY BANKSHARES price is 23.26 USD. The price is lower by -11.12% since the last closing and was between 23.03 USD and 27.08 USD. This implies that the price is at +1.00% from its lowest and at -14.11% from its highest.The Central Gaps scanner detects a bearish gap which is a sign that the sellers have taken the lead in the very short term.
Opening Gap DOWN
Type : Bearish
Timeframe : Openning
So that you have an overall view of the price change, here is a table showing the variations over several periods:
New LOW record (1 year)
Type : Bearish
Timeframe : Weekly
New LOW record (1st january)
Type : Bearish
Timeframe : Weekly
New LOW record (1 month)
Type : Bearish
Timeframe : Weekly
Abnormal volumes on FIRST COMMUNITY BANKSHARES were detected by the Central Volumes scanner:
Abnormal volumes
Timeframe : 50 days
Technical
Technical analysis of this Daily chart of FIRST COMMUNITY BANKSHARES indicates that the overall trend is strongly bearish. 92.86% of the signals given by moving averages are bearish. This strongly bearish trend is supported by the strong bearish signals given by short-term moving averages. There is no crossing of moving average by the price or crossing of moving averages between themselves.
An assessment of technical indicators shows a strong bearish signal.
Caution: the Central Indicators scanner currently detects an excess:
RSI indicator is oversold : under 30
Type : Neutral
Timeframe : Daily
CCI indicator is oversold : under -100
Type : Neutral
Timeframe : Daily
Williams %R indicator is oversold : under -80
Type : Neutral
Timeframe : Daily
Pivot points : price is under support 3
Type : Neutral
Timeframe : Daily
Pivot points : price is under support 3
Type : Neutral
Timeframe : Weekly
Price is back over the pivot point
Type : Bullish
Timeframe : Daily
Central Patterns, the scanner specializing in chart patterns, did not identify any signals.
No result was found by the Central Candlesticks scanner on Japanese candlesticks.
| S3 | S2 | S1 | Price | R1 | R2 | R3 | |
|---|---|---|---|---|---|---|---|
| ProTrendLines | 17.85 | 20.80 | 22.09 | 23.26 | 24.58 | 26.37 | 28.10 |
| Change (%) | -23.26% | -10.58% | -5.03% | - | +5.67% | +13.37% | +20.81% |
| Change | -5.41 | -2.46 | -1.17 | - | +1.32 | +3.11 | +4.84 |
| Level | Minor | Minor | Intermediate | - | Intermediate | Major | Minor |
To determine price objectives, it is also possible to use the pivot points. Here is the price position in relation to pivot points:
| Pivot points | S3 | S2 | S1 | PP | R1 | R2 | R3 |
|---|---|---|---|---|---|---|---|
| Standard | 24.64 | 25.08 | 25.62 | 26.06 | 26.60 | 27.04 | 27.58 |
| Camarilla | 25.90 | 25.99 | 26.08 | 26.17 | 26.26 | 26.35 | 26.44 |
| Woodie | 24.70 | 25.11 | 25.68 | 26.09 | 26.66 | 27.07 | 27.64 |
| Fibonacci | 25.08 | 25.45 | 25.68 | 26.06 | 26.43 | 26.66 | 27.04 |
| Pivot points | S3 | S2 | S1 | PP | R1 | R2 | R3 |
|---|---|---|---|---|---|---|---|
| Standard | 22.91 | 24.21 | 25.19 | 26.49 | 27.47 | 28.77 | 29.75 |
| Camarilla | 25.54 | 25.75 | 25.96 | 26.17 | 26.38 | 26.59 | 26.80 |
| Woodie | 22.75 | 24.13 | 25.03 | 26.41 | 27.31 | 28.69 | 29.59 |
| Fibonacci | 24.21 | 25.08 | 25.62 | 26.49 | 27.36 | 27.90 | 28.77 |
| Pivot points | S3 | S2 | S1 | PP | R1 | R2 | R3 |
|---|---|---|---|---|---|---|---|
| Standard | 18.20 | 21.85 | 24.01 | 27.66 | 29.82 | 33.47 | 35.63 |
| Camarilla | 24.56 | 25.10 | 25.63 | 26.16 | 26.69 | 27.23 | 27.76 |
| Woodie | 17.45 | 21.48 | 23.26 | 27.29 | 29.07 | 33.10 | 34.88 |
| Fibonacci | 21.85 | 24.07 | 25.44 | 27.66 | 29.88 | 31.25 | 33.47 |
Numerical data
The following is the status of technical indicators and moving averages registered at the time this technical analysis was created:
| RSI (14): | 20.59 | |
| MACD (12,26,9): | -1.2600 | |
| Directional Movement: | -35.13 | |
| AROON (14): | -78.57 | |
| DEMA (21): | 26.56 | |
| Parabolic SAR (0,02-0,02-0,2): | 28.31 | |
| Elder Ray (13): | -2.21 | |
| Super Trend (3,10): | 28.96 | |
| Zig ZAG (10): | 23.26 | |
| VORTEX (21): | 0.7000 | |
| Stochastique (14,3,5): | 11.25 | |
| TEMA (21): | 25.65 | |
| Williams %R (14): | -97.20 | |
| Chande Momentum Oscillator (20): | -7.79 | |
| Repulse (5,40,3): | -12.6900 | |
| ROCnROLL: | 2 | |
| TRIX (15,9): | -0.3400 | |
| Courbe Coppock: | 27.78 |
| MA7: | 26.30 | |
| MA20: | 28.74 | |
| MA50: | 29.66 | |
| MA100: | 30.51 | |
| MAexp7: | 26.20 | |
| MAexp20: | 27.98 | |
| MAexp50: | 29.28 | |
| MAexp100: | 30.23 | |
| Price / MA7: | -11.56% | |
| Price / MA20: | -19.07% | |
| Price / MA50: | -21.58% | |
| Price / MA100: | -23.76% | |
| Price / MAexp7: | -11.22% | |
| Price / MAexp20: | -16.87% | |
| Price / MAexp50: | -20.56% | |
| Price / MAexp100: | -23.06% |
News
Don"t forget to follow the news on FIRST COMMUNITY BANKSHARES. At the time of publication of this analysis, the latest news was as follows:
- SHAREHOLDER ALERT: WeissLaw LLP Investigates Highlands Bankshares, Inc.
- First Community Bancshares, Inc. Announces Fourth Quarter and Full Year 2016 Results and Quarterly Dividend
- First Community Bancshares, Inc. Announces Third Quarter 2016 Results and Quarterly Dividend
About author

Online


Add a comment
Comments
0 comments on the analysis FIRST COMMUNITY BANKSHARES - Daily