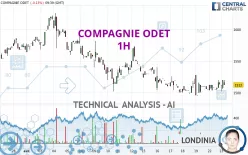
COMPAGNIE ODET - 1H - Technical analysis published on 04/23/2024 (GMT)
- 163
- 0
Click here for a new analysis!
- Timeframe : 1H
- - Analysis generated on
- Status : LEVEL MAINTAINED

Summary of the analysis

Additional analysis
Quotes
The COMPAGNIE ODET price is 1,512.0 EUR. The price registered a decrease of -0.13% on the session with the lowest point at 1,502.0 EUR and the highest point at 1,520.0 EUR. The deviation from the price is +0.67% for the low point and -0.53% for the high point.The Central Gaps scanner detects a bearish opening. A small advantage for sellers in the very short term.
Bearish opening
Type : Bearish
Timeframe : Openning
So that you have an overall view of the price change, here is a table showing the variations over several periods:
Near a new LOW record (1 month)
Type : Bearish
Timeframe : Weekly
The Central Volumes scanner notes the presence of abnormal volumes:
Abnormal volumes
Timeframe : 50 days
Technical
Technical analysis of this 1H chart of COMPAGNIE ODET indicates that the overall trend is bearish. The signals given by moving averages are 75.00% bearish. This bearish trend could slow down given the neutral signals currently being given by short-term moving averages. The Central Indicators scanner detects bearish signals on moving averages that could impact this trend:
Bearish price crossover with Moving Average 50
Type : Bearish
Timeframe : 1 hour
Bearish price crossover with adaptative moving average 20
Type : Bearish
Timeframe : 1 hour
The probability of a further increase is slight given the direction of the technical indicators.
Caution: the Central Indicators scanner currently detects an excess:
CCI indicator is overbought : over 100
Type : Neutral
Timeframe : 1 hour
Ichimoku : price is under the cloud
Type : Bearish
Timeframe : 1 hour
Price is back under the pivot point
Type : Bearish
Timeframe : 1 hour
An analysis of the price chart with the Central Patterns scanner (detector of chart patterns and resistances and supports) shows several results that can have an impact on the price change:
Near resistance of channel
Type : Bearish
Timeframe : 1 hour
Near horizontal support
Type : Bullish
Timeframe : 1 hour
Central Candlesticks, the scanner specialised in Japanese candlesticks, detects a bearish signal that could support the hypothesis of a small drop in the very short term:
Bearish harami
Type : Bearish
Timeframe : 1 hour
| S3 | S2 | S1 | Price | R1 | R2 | R3 | |
|---|---|---|---|---|---|---|---|
| ProTrendLines | 1,350.0 | 1,396.6 | 1,506.6 | 1,512.0 | 1,536.0 | 1,570.0 | 1,600.0 |
| Change (%) | -10.71% | -7.63% | -0.36% | - | +1.59% | +3.84% | +5.82% |
| Change | -162.0 | -115.4 | -5.4 | - | +24.0 | +58.0 | +88.0 |
| Level | Minor | Major | Major | - | Intermediate | Intermediate | Minor |
Attention could also be paid to pivot points to set price objectives:
| Pivot points | S3 | S2 | S1 | PP | R1 | R2 | R3 |
|---|---|---|---|---|---|---|---|
| Standard | 1,489.3 | 1,496.7 | 1,505.3 | 1,512.7 | 1,521.3 | 1,528.7 | 1,537.3 |
| Camarilla | 1,509.6 | 1,511.1 | 1,512.5 | 1,514.0 | 1,515.5 | 1,516.9 | 1,518.4 |
| Woodie | 1,490.0 | 1,497.0 | 1,506.0 | 1,513.0 | 1,522.0 | 1,529.0 | 1,538.0 |
| Fibonacci | 1,496.7 | 1,502.8 | 1,506.6 | 1,512.7 | 1,518.8 | 1,522.6 | 1,528.7 |
| Pivot points | S3 | S2 | S1 | PP | R1 | R2 | R3 |
|---|---|---|---|---|---|---|---|
| Standard | 1,444.0 | 1,470.0 | 1,488.0 | 1,514.0 | 1,532.0 | 1,558.0 | 1,576.0 |
| Camarilla | 1,493.9 | 1,497.9 | 1,502.0 | 1,506.0 | 1,510.0 | 1,514.1 | 1,518.1 |
| Woodie | 1,440.0 | 1,468.0 | 1,484.0 | 1,512.0 | 1,528.0 | 1,556.0 | 1,572.0 |
| Fibonacci | 1,470.0 | 1,486.8 | 1,497.2 | 1,514.0 | 1,530.8 | 1,541.2 | 1,558.0 |
| Pivot points | S3 | S2 | S1 | PP | R1 | R2 | R3 |
|---|---|---|---|---|---|---|---|
| Standard | 1,177.3 | 1,262.7 | 1,415.3 | 1,500.7 | 1,653.3 | 1,738.7 | 1,891.3 |
| Camarilla | 1,502.6 | 1,524.4 | 1,546.2 | 1,568.0 | 1,589.8 | 1,611.6 | 1,633.5 |
| Woodie | 1,211.0 | 1,279.5 | 1,449.0 | 1,517.5 | 1,687.0 | 1,755.5 | 1,925.0 |
| Fibonacci | 1,262.7 | 1,353.6 | 1,409.8 | 1,500.7 | 1,591.6 | 1,647.8 | 1,738.7 |
Numerical data
The following are the details of the technical indicators and moving averages that were collected to generate this technical analysis:
| RSI (14): | 50.80 | |
| MACD (12,26,9): | 0.8000 | |
| Directional Movement: | 9.7 | |
| AROON (14): | -14.3 | |
| DEMA (21): | 1,511.0 | |
| Parabolic SAR (0,02-0,02-0,2): | 1,496.5 | |
| Elder Ray (13): | 4.5 | |
| Super Trend (3,10): | 1,494.9 | |
| Zig ZAG (10): | 1,512.0 | |
| VORTEX (21): | 0.9000 | |
| Stochastique (14,3,5): | 70.40 | |
| TEMA (21): | 1,514.7 | |
| Williams %R (14): | -44.40 | |
| Chande Momentum Oscillator (20): | 6.0 | |
| Repulse (5,40,3): | 0.6000 | |
| ROCnROLL: | -1 | |
| TRIX (15,9): | 0.0000 | |
| Courbe Coppock: | 0.80 |
| MA7: | 1,511.4 | |
| MA20: | 1,542.8 | |
| MA50: | 1,486.6 | |
| MA100: | 1,459.5 | |
| MAexp7: | 1,513.1 | |
| MAexp20: | 1,510.8 | |
| MAexp50: | 1,515.2 | |
| MAexp100: | 1,523.6 | |
| Price / MA7: | +0.04% | |
| Price / MA20: | -2.00% | |
| Price / MA50: | +1.71% | |
| Price / MA100: | +3.60% | |
| Price / MAexp7: | -0.07% | |
| Price / MAexp20: | +0.08% | |
| Price / MAexp50: | -0.21% | |
| Price / MAexp100: | -0.76% |
News
The last news published on COMPAGNIE ODET at the time of the generation of this analysis was as follows:
- Compagnie de l'Odet : Communiqué de mise à disposition du rapport financier semestriel 2023
- Compagnie de l'Odet : Financial information for the first quarter 2023
- COMPAGNIE DE L'ODET : 2022 RESULTS
- Compagnie de l'Odet : Financial information for Q3 2022
- Compagnie de l'Odet : first-half 2022 results
About author
Online


Add a comment
Comments
0 comments on the analysis COMPAGNIE ODET - 1H