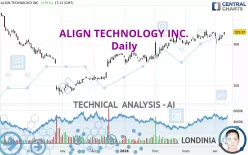
ALIGN TECHNOLOGY INC. - Daily - Technical analysis published on 04/09/2024 (GMT)
- 170
- 0
Click here for a new analysis!
- Timeframe : Daily
- - Analysis generated on
- Status : INVALID

Summary of the analysis

Additional analysis
Quotes
ALIGN TECHNOLOGY INC. rating 329.37 USD. The price has increased by +2.91% since the last closing with the lowest point at 322.21 USD and the highest point at 329.43 USD. The deviation from the price is +2.22% for the low point and -0.02% for the high point.A bullish gap was detected at the opening by the Central Gaps scanner. There are a lot of buyers and they have the upper hand in the very short term.
Opening Gap UP
Type : Bullish
Timeframe : Openning
So that you have an overall view of the price change, here is a table showing the variations over several periods:
Near a new HIGH record (1st january)
Type : Bullish
Timeframe : Weekly
Near a new HIGH record (1 month)
Type : Bullish
Timeframe : Weekly
Technical
Technical analysis of ALIGN TECHNOLOGY INC. in Daily shows a strongly overall bullish trend. 92.86% of the signals given by moving averages are bullish. This strongly bullish trend is supported by the strong bullish signals given by short-term moving averages. The Central Indicators market scanner currently does not detect any result that concerns moving averages.
In fact, 13 technical indicators on 18 studied are currently positioned bullish. Caution: the Central Indicators scanner currently detects an excess:
CCI indicator is overbought : over 100
Type : Neutral
Timeframe : Daily
Williams %R indicator is overbought : over -20
Type : Neutral
Timeframe : Daily
Pivot points : price is over resistance 3
Type : Neutral
Timeframe : Daily
Parabolic SAR indicator bullish reversal
Type : Bullish
Timeframe : Daily
Momentum indicator is back over 0
Type : Bullish
Timeframe : Daily
An analysis of the price chart with the Central Patterns scanner (detector of chart patterns and resistances and supports) shows several results that can have an impact on the price change:
Near horizontal resistance
Type : Bearish
Timeframe : Daily
Near resistance of channel
Type : Bearish
Timeframe : Daily
For a small rebound in the very short term, the Central Candlesticks scanner currently notes the presence of this bullish pattern in Japanese candlesticks:
Upside gap
Type : Bullish
Timeframe : Daily
| S3 | S2 | S1 | Price | R1 | R2 | R3 | |
|---|---|---|---|---|---|---|---|
| ProTrendLines | 256.65 | 280.03 | 299.33 | 329.37 | 331.08 | 360.26 | 392.98 |
| Change (%) | -22.08% | -14.98% | -9.12% | - | +0.52% | +9.38% | +19.31% |
| Change | -72.72 | -49.34 | -30.04 | - | +1.71 | +30.89 | +63.61 |
| Level | Intermediate | Intermediate | Major | - | Major | Minor | Major |
Pivot points can also be used to set your price objectives. Here is the price situation in relation to pivot points:
| Pivot points | S3 | S2 | S1 | PP | R1 | R2 | R3 |
|---|---|---|---|---|---|---|---|
| Standard | 311.33 | 313.84 | 316.95 | 319.46 | 322.57 | 325.08 | 328.19 |
| Camarilla | 318.52 | 319.03 | 319.55 | 320.06 | 320.58 | 321.09 | 321.61 |
| Woodie | 311.63 | 313.99 | 317.25 | 319.61 | 322.87 | 325.23 | 328.49 |
| Fibonacci | 313.84 | 315.99 | 317.31 | 319.46 | 321.61 | 322.93 | 325.08 |
| Pivot points | S3 | S2 | S1 | PP | R1 | R2 | R3 |
|---|---|---|---|---|---|---|---|
| Standard | 275.57 | 288.17 | 302.88 | 315.48 | 330.19 | 342.79 | 357.50 |
| Camarilla | 310.07 | 312.57 | 315.08 | 317.58 | 320.08 | 322.59 | 325.09 |
| Woodie | 276.62 | 288.70 | 303.93 | 316.01 | 331.24 | 343.32 | 358.55 |
| Fibonacci | 288.17 | 298.61 | 305.05 | 315.48 | 325.92 | 332.36 | 342.79 |
| Pivot points | S3 | S2 | S1 | PP | R1 | R2 | R3 |
|---|---|---|---|---|---|---|---|
| Standard | 264.98 | 280.56 | 304.24 | 319.82 | 343.50 | 359.08 | 382.76 |
| Camarilla | 317.12 | 320.72 | 324.32 | 327.92 | 331.52 | 335.12 | 338.72 |
| Woodie | 269.03 | 282.59 | 308.29 | 321.85 | 347.55 | 361.11 | 386.81 |
| Fibonacci | 280.56 | 295.56 | 304.82 | 319.82 | 334.82 | 344.08 | 359.08 |
Numerical data
The following is the status of the technical indicators and moving averages at the time of publication of this technical analysis:
| RSI (14): | 61.66 | |
| MACD (12,26,9): | 4.1600 | |
| Directional Movement: | 9.04 | |
| AROON (14): | -50.00 | |
| DEMA (21): | 323.66 | |
| Parabolic SAR (0,02-0,02-0,2): | 300.78 | |
| Elder Ray (13): | 6.53 | |
| Super Trend (3,10): | 302.46 | |
| Zig ZAG (10): | 329.15 | |
| VORTEX (21): | 0.9700 | |
| Stochastique (14,3,5): | 62.05 | |
| TEMA (21): | 321.07 | |
| Williams %R (14): | -18.01 | |
| Chande Momentum Oscillator (20): | 7.89 | |
| Repulse (5,40,3): | 4.1700 | |
| ROCnROLL: | 1 | |
| TRIX (15,9): | 0.2200 | |
| Courbe Coppock: | 1.55 |
| MA7: | 317.62 | |
| MA20: | 319.23 | |
| MA50: | 306.27 | |
| MA100: | 275.94 | |
| MAexp7: | 320.52 | |
| MAexp20: | 317.44 | |
| MAexp50: | 305.33 | |
| MAexp100: | 293.17 | |
| Price / MA7: | +3.70% | |
| Price / MA20: | +3.18% | |
| Price / MA50: | +7.54% | |
| Price / MA100: | +19.36% | |
| Price / MAexp7: | +2.76% | |
| Price / MAexp20: | +3.76% | |
| Price / MAexp50: | +7.87% | |
| Price / MAexp100: | +12.35% |
News
The last news published on ALIGN TECHNOLOGY INC. at the time of the generation of this analysis was as follows:
- SHAREHOLDER ALERT: Pomerantz Law Firm Investigates Claims On Align Technology, Inc. - ALGN
- SHAREHOLDER ALERT: Pomerantz Law Firm Investigates Claims On Align Technology, Inc. - ALGN
- Align Technology Announces Second Quarter 2023 Financial Results
- Align Technology to Announce Second Quarter 2023 Results on July 26, 2023
- Align Technology to Speak at Upcoming Financial Conferences
About author
Online


Add a comment
Comments
0 comments on the analysis ALIGN TECHNOLOGY INC. - Daily