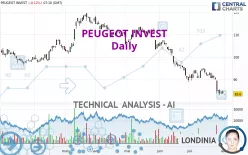
PEUGEOT INVEST - Daily - Technical analysis published on 08/01/2024 (GMT)
- 139
- 0
Click here for a new analysis!
- Timeframe : Daily
- - Analysis generated on
- Status : TARGET REACHED

Summary of the analysis

Additional analysis
Quotes
The PEUGEOT INVEST price is 83.6 EUR. On the day, this instrument lost -0.12% and was traded between 83.6 EUR and 83.6 EUR over the period. The price is currently at 0% from its lowest and 0% from its highest.The Central Gaps scanner detects the formation of a bearish gap marking the strong presence of sellers ahead of buyers at the opening. This formed a quotation gap.
Opening Gap DOWN
Type : Bearish
Timeframe : Openning
So that you have an overall view of the price change, here is a table showing the variations over several periods:
Near a new LOW record (1 year)
Type : Bearish
Timeframe : Weekly
Near a new LOW record (1st january)
Type : Bearish
Timeframe : Weekly
Near a new LOW record (1 month)
Type : Bearish
Timeframe : Weekly
Technical
A technical analysis in Daily of this PEUGEOT INVEST chart shows a sharp bearish trend. 92.86% of the signals given by moving averages are bearish. This strongly bearish trend is supported by the strong bearish signals given by short-term moving averages. The Central Indicators scanner does not detect any result on moving averages that would impact this trend.
An assessment of technical indicators shows a bearish signal.
Caution: the Central Indicators scanner currently detects an excess:
RSI indicator is oversold : under 30
Type : Neutral
Timeframe : Daily
CCI indicator is oversold : under -100
Type : Neutral
Timeframe : Daily
Williams %R indicator is oversold : under -80
Type : Neutral
Timeframe : Daily
Central Patterns, the market scanner focusing on chart patterns, resistances and supports found this result:
Near support of channel
Type : Bullish
Timeframe : Daily
Central Candlesticks, the scanner specialised in Japanese candlesticks, detects these signals that could have an impact on the current short-term trend:
Bullish doji star
Type : Bullish
Timeframe : Daily
Doji
Type : Neutral
Timeframe : Daily
| S3 | S2 | S1 | Price | R1 | R2 | R3 | |
|---|---|---|---|---|---|---|---|
| ProTrendLines | 58.3 | 72.2 | 78.5 | 83.6 | 86.8 | 94.3 | 96.9 |
| Change (%) | -30.26% | -13.64% | -6.10% | - | +3.83% | +12.80% | +15.91% |
| Change | -25.3 | -11.4 | -5.1 | - | +3.2 | +10.7 | +13.3 |
| Level | Intermediate | Major | Intermediate | - | Intermediate | Major | Intermediate |
To determine price objectives, it is also possible to use the pivot points. Here is the price position in relation to pivot points:
| Pivot points | S3 | S2 | S1 | PP | R1 | R2 | R3 |
|---|---|---|---|---|---|---|---|
| Standard | 81.8 | 82.8 | 83.2 | 84.2 | 84.6 | 85.6 | 86.0 |
| Camarilla | 83.3 | 83.4 | 83.6 | 83.7 | 83.8 | 84.0 | 84.1 |
| Woodie | 81.6 | 82.7 | 83.0 | 84.1 | 84.4 | 85.5 | 85.8 |
| Fibonacci | 82.8 | 83.3 | 83.6 | 84.2 | 84.7 | 85.0 | 85.6 |
| Pivot points | S3 | S2 | S1 | PP | R1 | R2 | R3 |
|---|---|---|---|---|---|---|---|
| Standard | 73.3 | 78.4 | 81.8 | 86.9 | 90.3 | 95.4 | 98.8 |
| Camarilla | 82.8 | 83.5 | 84.3 | 85.1 | 85.9 | 86.7 | 87.4 |
| Woodie | 72.4 | 78.0 | 80.9 | 86.5 | 89.4 | 95.0 | 97.9 |
| Fibonacci | 78.4 | 81.7 | 83.7 | 86.9 | 90.2 | 92.2 | 95.4 |
| Pivot points | S3 | S2 | S1 | PP | R1 | R2 | R3 |
|---|---|---|---|---|---|---|---|
| Standard | 67.2 | 75.1 | 79.4 | 87.3 | 91.6 | 99.5 | 103.8 |
| Camarilla | 80.4 | 81.5 | 82.6 | 83.7 | 84.8 | 85.9 | 87.1 |
| Woodie | 65.4 | 74.2 | 77.6 | 86.4 | 89.8 | 98.6 | 102.0 |
| Fibonacci | 75.1 | 79.8 | 82.6 | 87.3 | 92.0 | 94.8 | 99.5 |
Numerical data
The following are the details of the technical indicators and moving averages that were collected to generate this technical analysis:
| RSI (14): | 26.20 | |
| MACD (12,26,9): | -3.3000 | |
| Directional Movement: | -27.7 | |
| AROON (14): | -78.6 | |
| DEMA (21): | 84.7 | |
| Parabolic SAR (0,02-0,02-0,2): | 90.2 | |
| Elder Ray (13): | -3.6 | |
| Super Trend (3,10): | 89.1 | |
| Zig ZAG (10): | 83.6 | |
| VORTEX (21): | 0.8000 | |
| Stochastique (14,3,5): | 6.60 | |
| TEMA (21): | 84.0 | |
| Williams %R (14): | -95.00 | |
| Chande Momentum Oscillator (20): | -8.7 | |
| Repulse (5,40,3): | -2.7000 | |
| ROCnROLL: | 2 | |
| TRIX (15,9): | -0.4000 | |
| Courbe Coppock: | 16.50 |
| MA7: | 85.0 | |
| MA20: | 89.8 | |
| MA50: | 95.8 | |
| MA100: | 102.6 | |
| MAexp7: | 85.3 | |
| MAexp20: | 88.9 | |
| MAexp50: | 94.2 | |
| MAexp100: | 97.9 | |
| Price / MA7: | -1.65% | |
| Price / MA20: | -6.90% | |
| Price / MA50: | -12.73% | |
| Price / MA100: | -18.52% | |
| Price / MAexp7: | -1.99% | |
| Price / MAexp20: | -5.96% | |
| Price / MAexp50: | -11.25% | |
| Price / MAexp100: | -14.61% |
About author
Online


Add a comment
Comments
0 comments on the analysis PEUGEOT INVEST - Daily