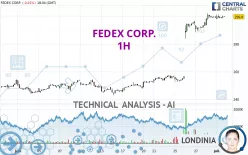
FEDEX CORP. - 1H - Technical analysis published on 07/01/2024 (GMT)
- 204
- 0
Click here for a new analysis!
- Timeframe : 1H
- - Analysis generated on
- Status : LEVEL MAINTAINED

Summary of the analysis

Additional analysis
Quotes
The FEDEX CORP. rating is 299.80 USD. On the day, this instrument lost -0.01% and was between 297.84 USD and 301.28 USD. This implies that the price is at +0.66% from its lowest and at -0.49% from its highest.The Central Gaps scanner detects a bearish opening. A small advantage for sellers in the very short term.
Bearish opening
Type : Bearish
Timeframe : Openning
A study of price movements over other periods shows the following variations:
Near a new HIGH record (5 years)
Type : Bullish
Timeframe : Weekly
Near a new HIGH record (1 year)
Type : Bullish
Timeframe : Weekly
Near a new HIGH record (1st january)
Type : Bullish
Timeframe : Weekly
Near a new HIGH record (1 month)
Type : Bullish
Timeframe : Weekly
The Central Volumes scanner notes the presence of abnormal volumes:
Abnormal volumes
Timeframe : 5 days
Technical
Technical analysis of this 1H chart of FEDEX CORP. indicates that the overall trend is strongly bullish. The signals given by the moving averages are 92.86% bullish. This strong bullish trend is confirmed by the strong signals currently being given by short-term moving averages. There is no crossing of moving average by the price or crossing of moving averages between themselves.
In fact, 10 technical indicators on 18 studied are currently bullish. Caution: the Central Indicators scanner currently detects an excess:
RSI indicator is overbought : over 70
Type : Neutral
Timeframe : 1 hour
The Central Patterns scanner, which studies chart patterns, resistances and supports, has identified this signal:
Near horizontal resistance
Type : Bearish
Timeframe : 1 hour
For a small rebound in the very short term, the Central Candlesticks scanner currently notes the presence of this bullish pattern in Japanese candlesticks:
White morning star
Type : Bullish
Timeframe : 1 hour
| S3 | S2 | S1 | Price | |
|---|---|---|---|---|
| ProTrendLines | 264.56 | 288.16 | 298.80 | 299.80 |
| Change (%) | -11.75% | -3.88% | -0.33% | - |
| Change | -35.24 | -11.64 | -1.00 | - |
| Level | Intermediate | Major | Major | - |
To determine price objectives, it is also possible to use the pivot points. Here is the price position in relation to pivot points:
| Pivot points | S3 | S2 | S1 | PP | R1 | R2 | R3 |
|---|---|---|---|---|---|---|---|
| Standard | 285.75 | 289.59 | 294.72 | 298.56 | 303.69 | 307.53 | 312.66 |
| Camarilla | 297.37 | 298.20 | 299.02 | 299.84 | 300.66 | 301.49 | 302.31 |
| Woodie | 286.39 | 289.91 | 295.36 | 298.88 | 304.33 | 307.85 | 313.30 |
| Fibonacci | 289.59 | 293.02 | 295.14 | 298.56 | 301.99 | 304.11 | 307.53 |
| Pivot points | S3 | S2 | S1 | PP | R1 | R2 | R3 |
|---|---|---|---|---|---|---|---|
| Standard | 217.68 | 235.14 | 267.49 | 284.95 | 317.30 | 334.76 | 367.11 |
| Camarilla | 286.14 | 290.71 | 295.27 | 299.84 | 304.41 | 308.97 | 313.54 |
| Woodie | 225.13 | 238.86 | 274.94 | 288.67 | 324.75 | 338.48 | 374.56 |
| Fibonacci | 235.14 | 254.17 | 265.92 | 284.95 | 303.98 | 315.73 | 334.76 |
| Pivot points | S3 | S2 | S1 | PP | R1 | R2 | R3 |
|---|---|---|---|---|---|---|---|
| Standard | 199.35 | 220.47 | 260.16 | 281.28 | 320.97 | 342.09 | 381.78 |
| Camarilla | 283.12 | 288.69 | 294.27 | 299.84 | 305.41 | 310.99 | 316.56 |
| Woodie | 208.63 | 225.11 | 269.44 | 285.92 | 330.25 | 346.73 | 391.06 |
| Fibonacci | 220.47 | 243.70 | 258.05 | 281.28 | 304.51 | 318.86 | 342.09 |
Numerical data
The following are the details of the technical indicators and moving averages that were collected to generate this technical analysis:
| RSI (14): | 76.84 | |
| MACD (12,26,9): | 6.5000 | |
| Directional Movement: | 31.40 | |
| AROON (14): | 28.57 | |
| DEMA (21): | 304.44 | |
| Parabolic SAR (0,02-0,02-0,2): | 302.06 | |
| Elder Ray (13): | 1.62 | |
| Super Trend (3,10): | 292.56 | |
| Zig ZAG (10): | 300.47 | |
| VORTEX (21): | 1.0600 | |
| Stochastique (14,3,5): | 72.84 | |
| TEMA (21): | 303.22 | |
| Williams %R (14): | -20.88 | |
| Chande Momentum Oscillator (20): | 4.64 | |
| Repulse (5,40,3): | 0.4900 | |
| ROCnROLL: | 1 | |
| TRIX (15,9): | 0.4200 | |
| Courbe Coppock: | 4.25 |
| MA7: | 279.53 | |
| MA20: | 259.00 | |
| MA50: | 258.29 | |
| MA100: | 257.12 | |
| MAexp7: | 299.52 | |
| MAexp20: | 294.77 | |
| MAexp50: | 281.09 | |
| MAexp100: | 269.37 | |
| Price / MA7: | +7.25% | |
| Price / MA20: | +15.75% | |
| Price / MA50: | +16.07% | |
| Price / MA100: | +16.60% | |
| Price / MAexp7: | +0.09% | |
| Price / MAexp20: | +1.71% | |
| Price / MAexp50: | +6.66% | |
| Price / MAexp100: | +11.30% |
News
The latest news and videos published on FEDEX CORP. at the time of the analysis were as follows:
- FedEx and EIT Climate-KIC Propel Sustainable Mobility Initiatives in European Cities
- Electrification 101: How Fleets and Utilities Can Work Together To Unlock Electrified Transportation
- FedEx Awards More Than $230,000 to 10 Small Businesses
- Flooding in Southern Brazil
- The 2023 FedEx Cares Report Is Now Available
About author
Online


Add a comment
Comments
0 comments on the analysis FEDEX CORP. - 1H